


Century 21 People’s Choice Realty Inc., Brokerage
120 MATHESON BLVD E #103
MISSISSAUGA, Ontario
L4Z 1X1

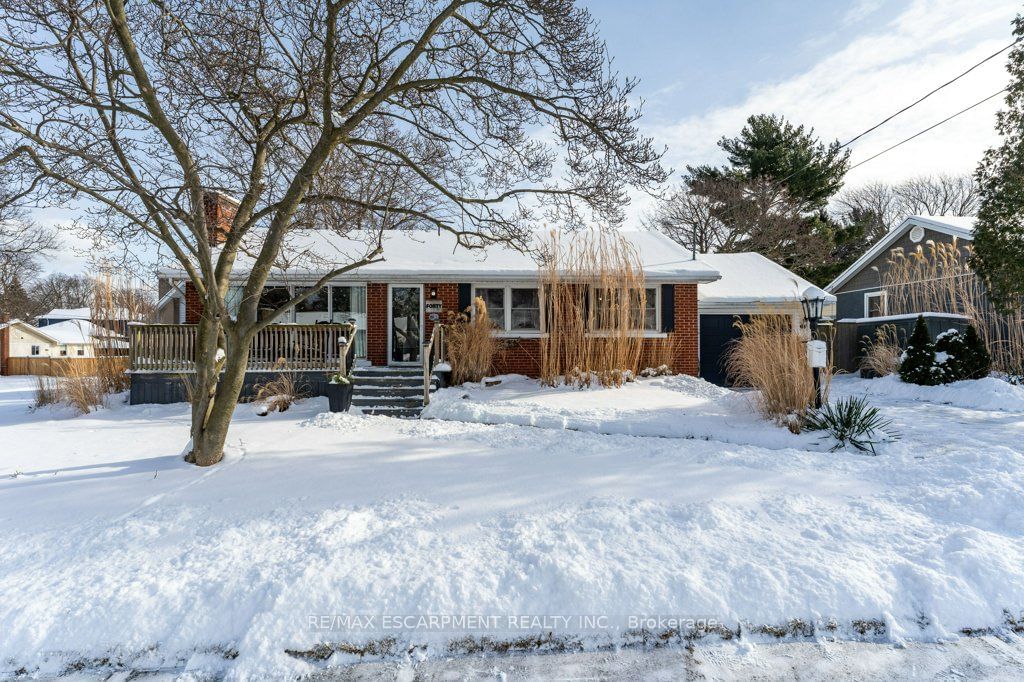
St. Catharines, Lakeport, L2N 2L6
$649,500
Listed by ROYAL LEPAGE NRC REALTY.
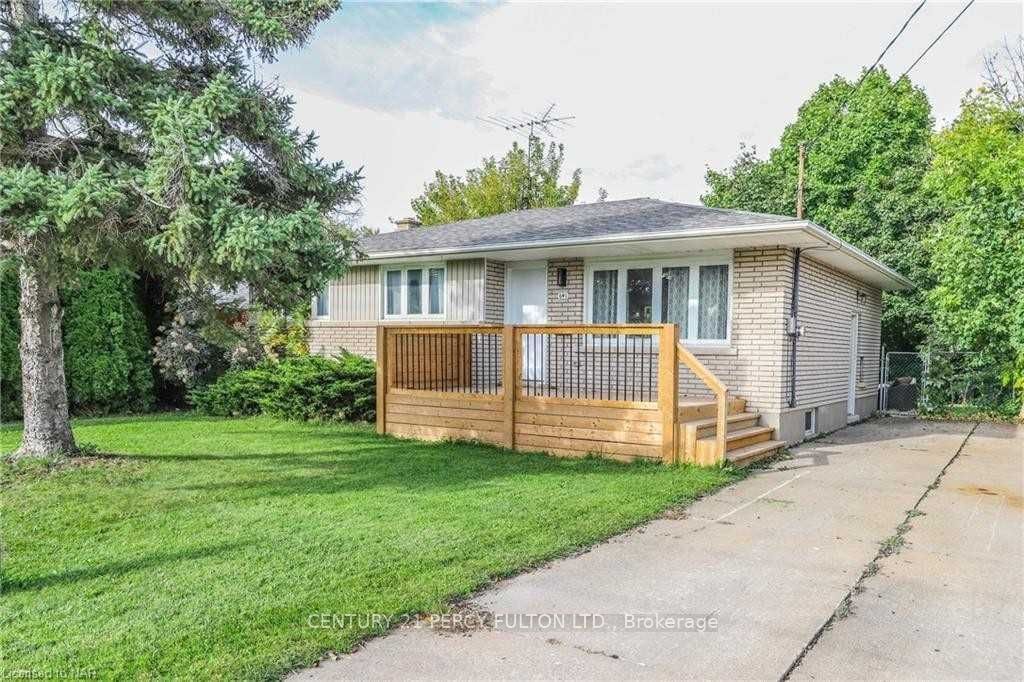
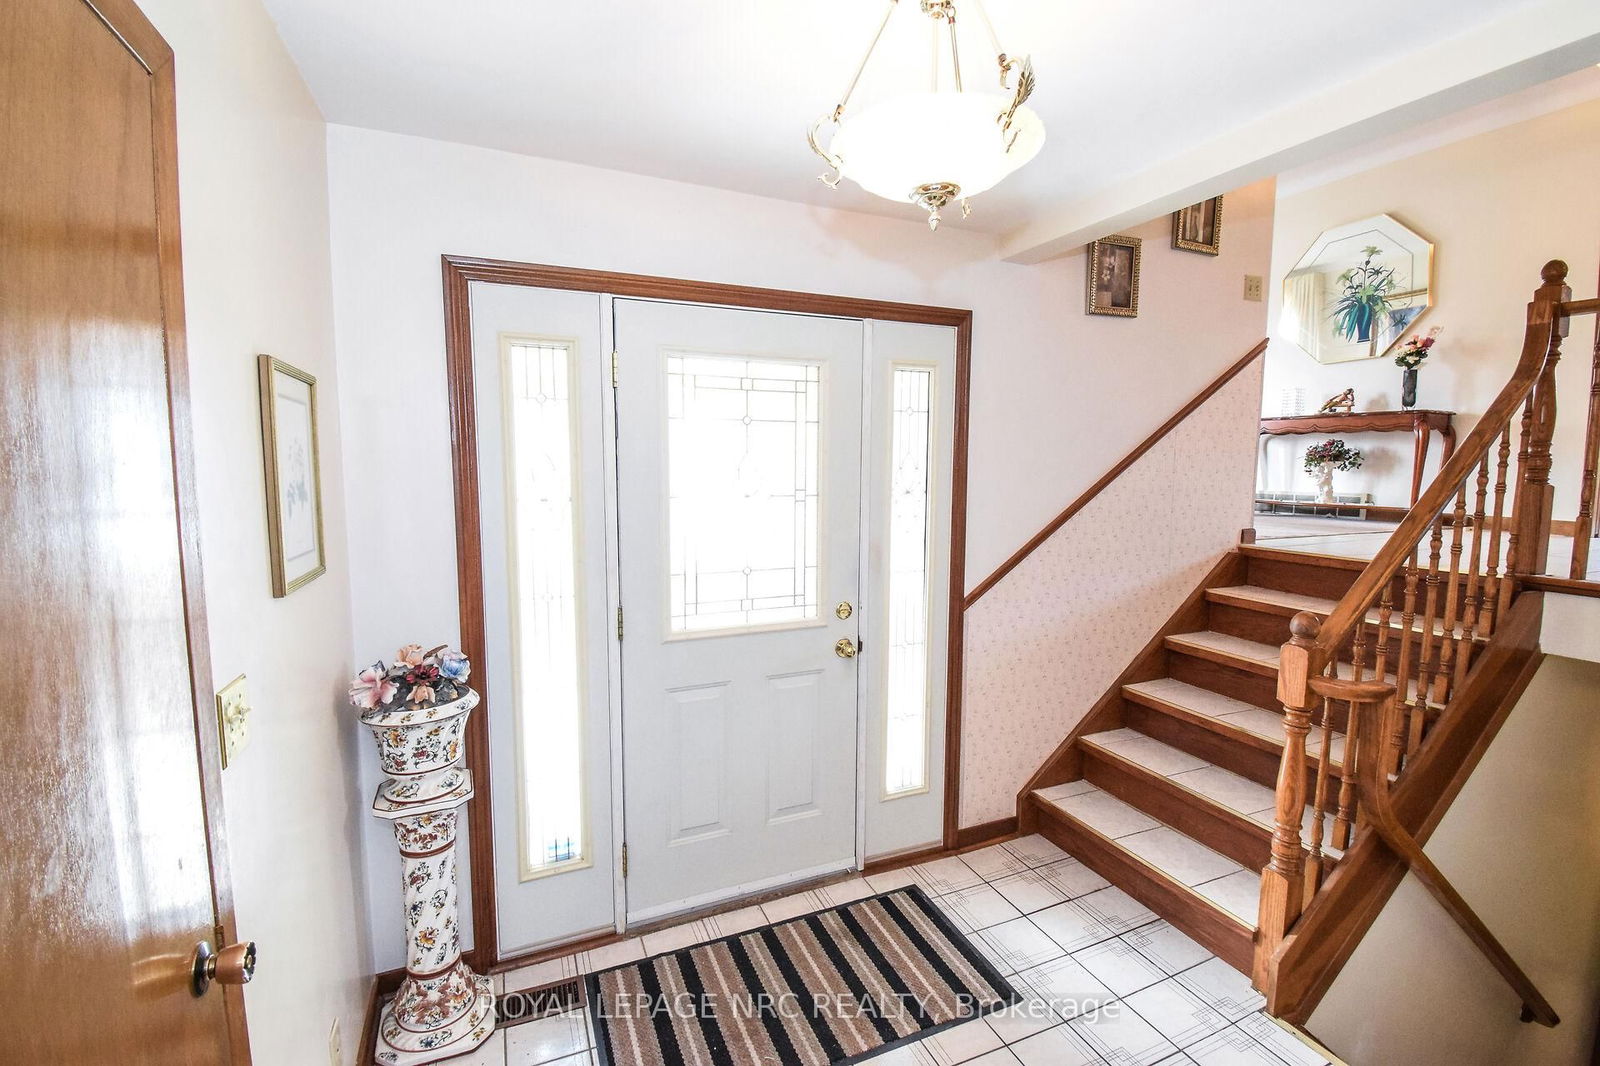
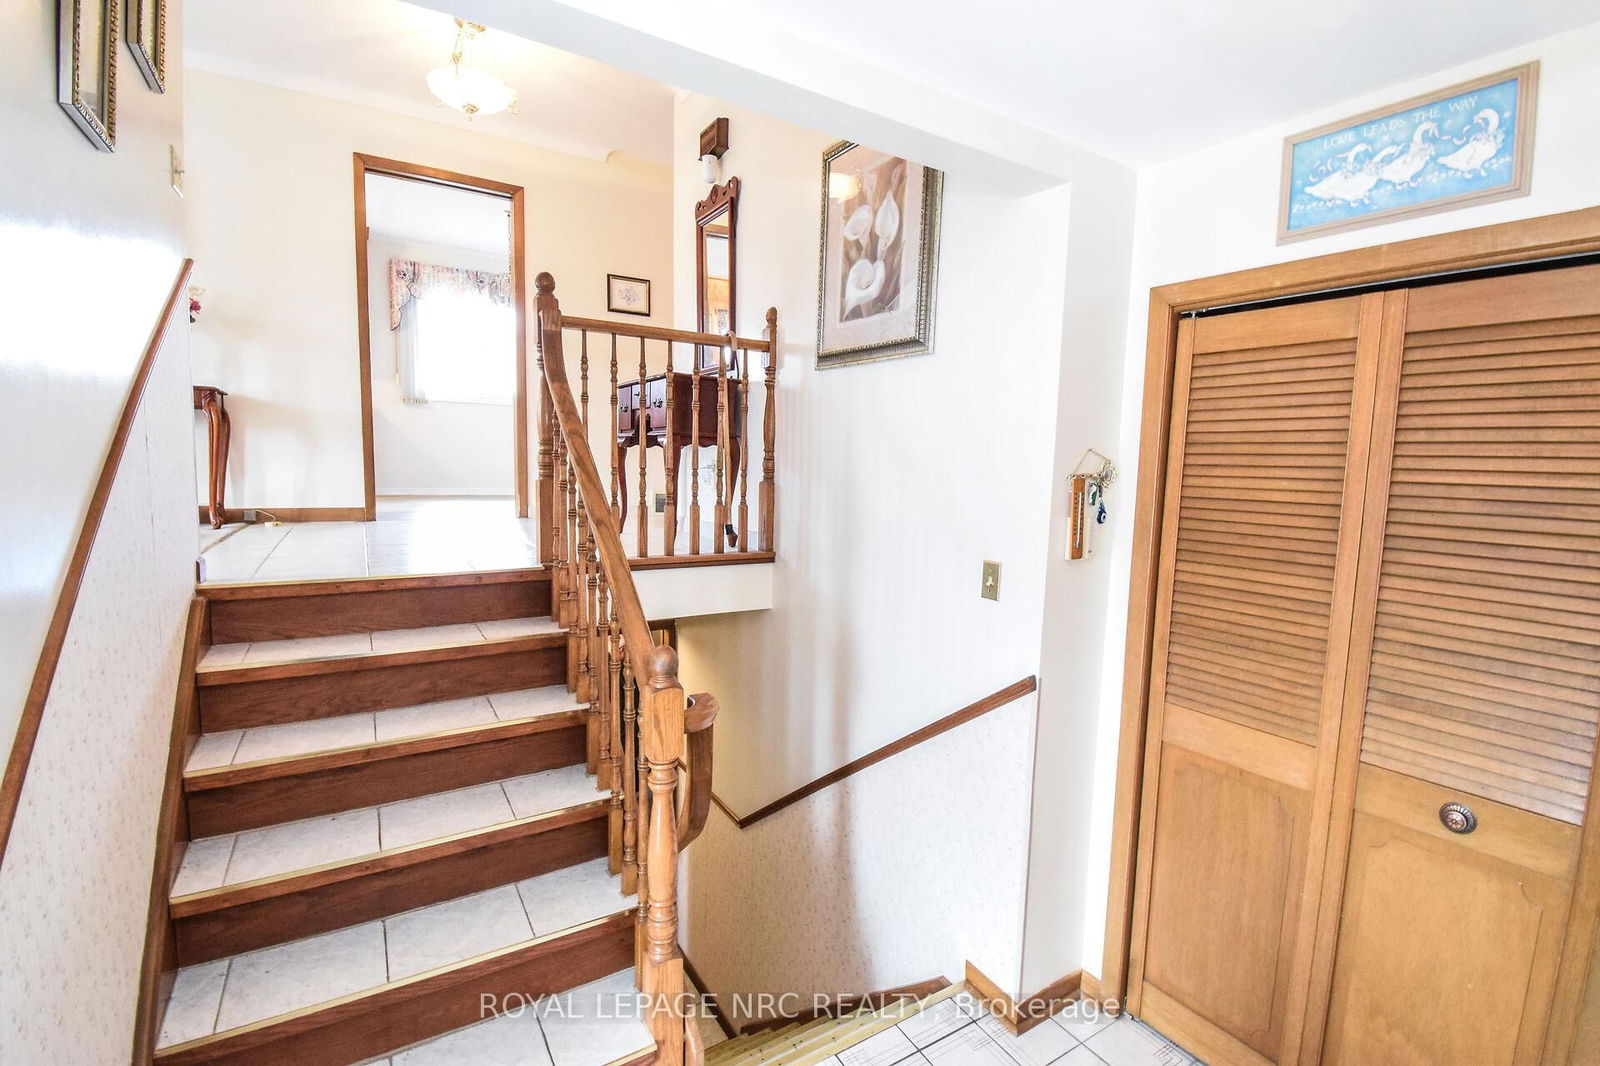
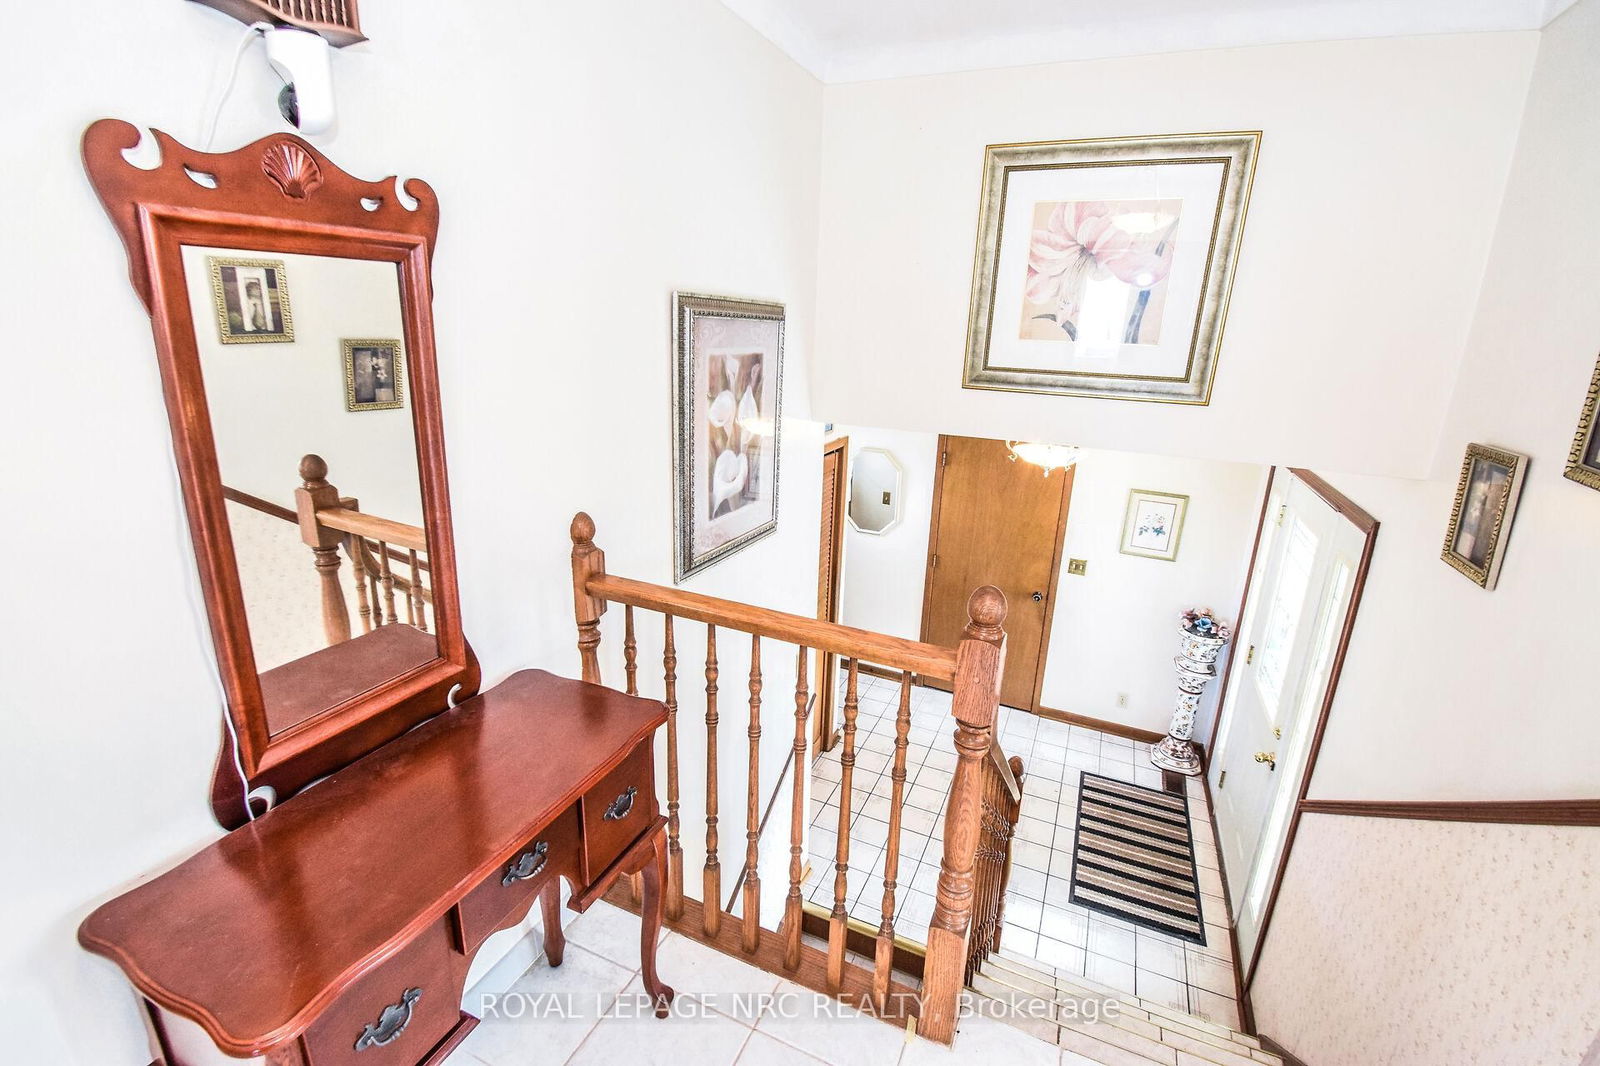
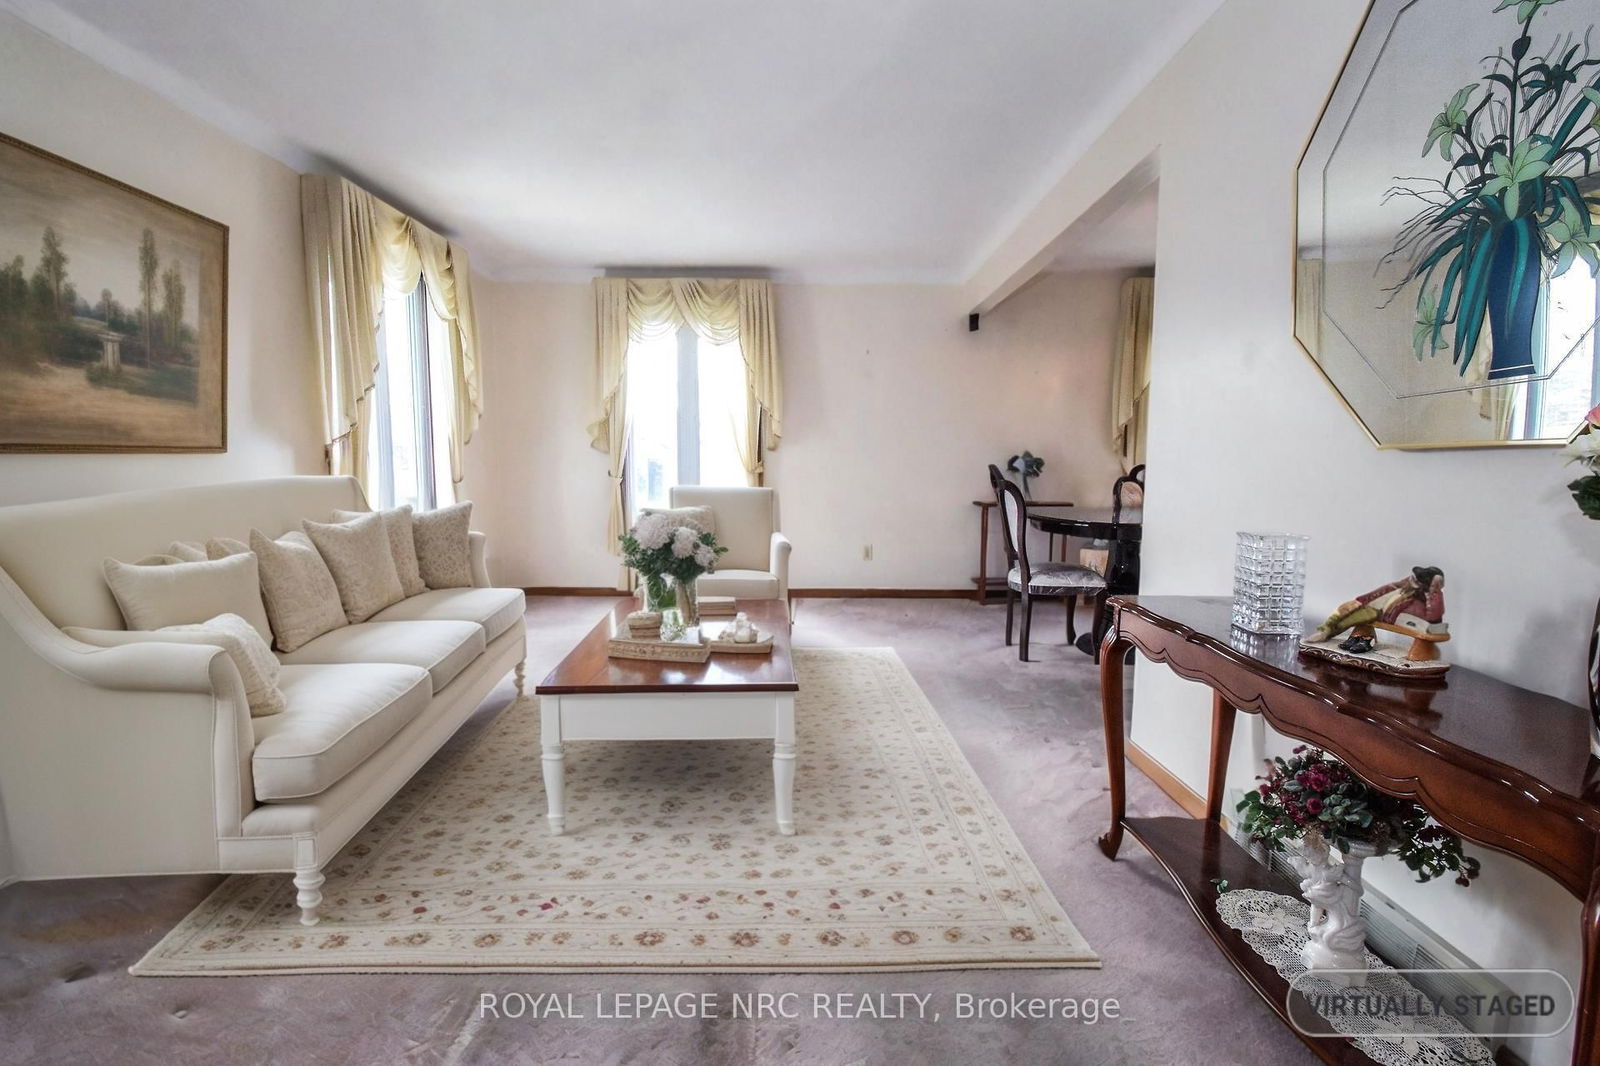
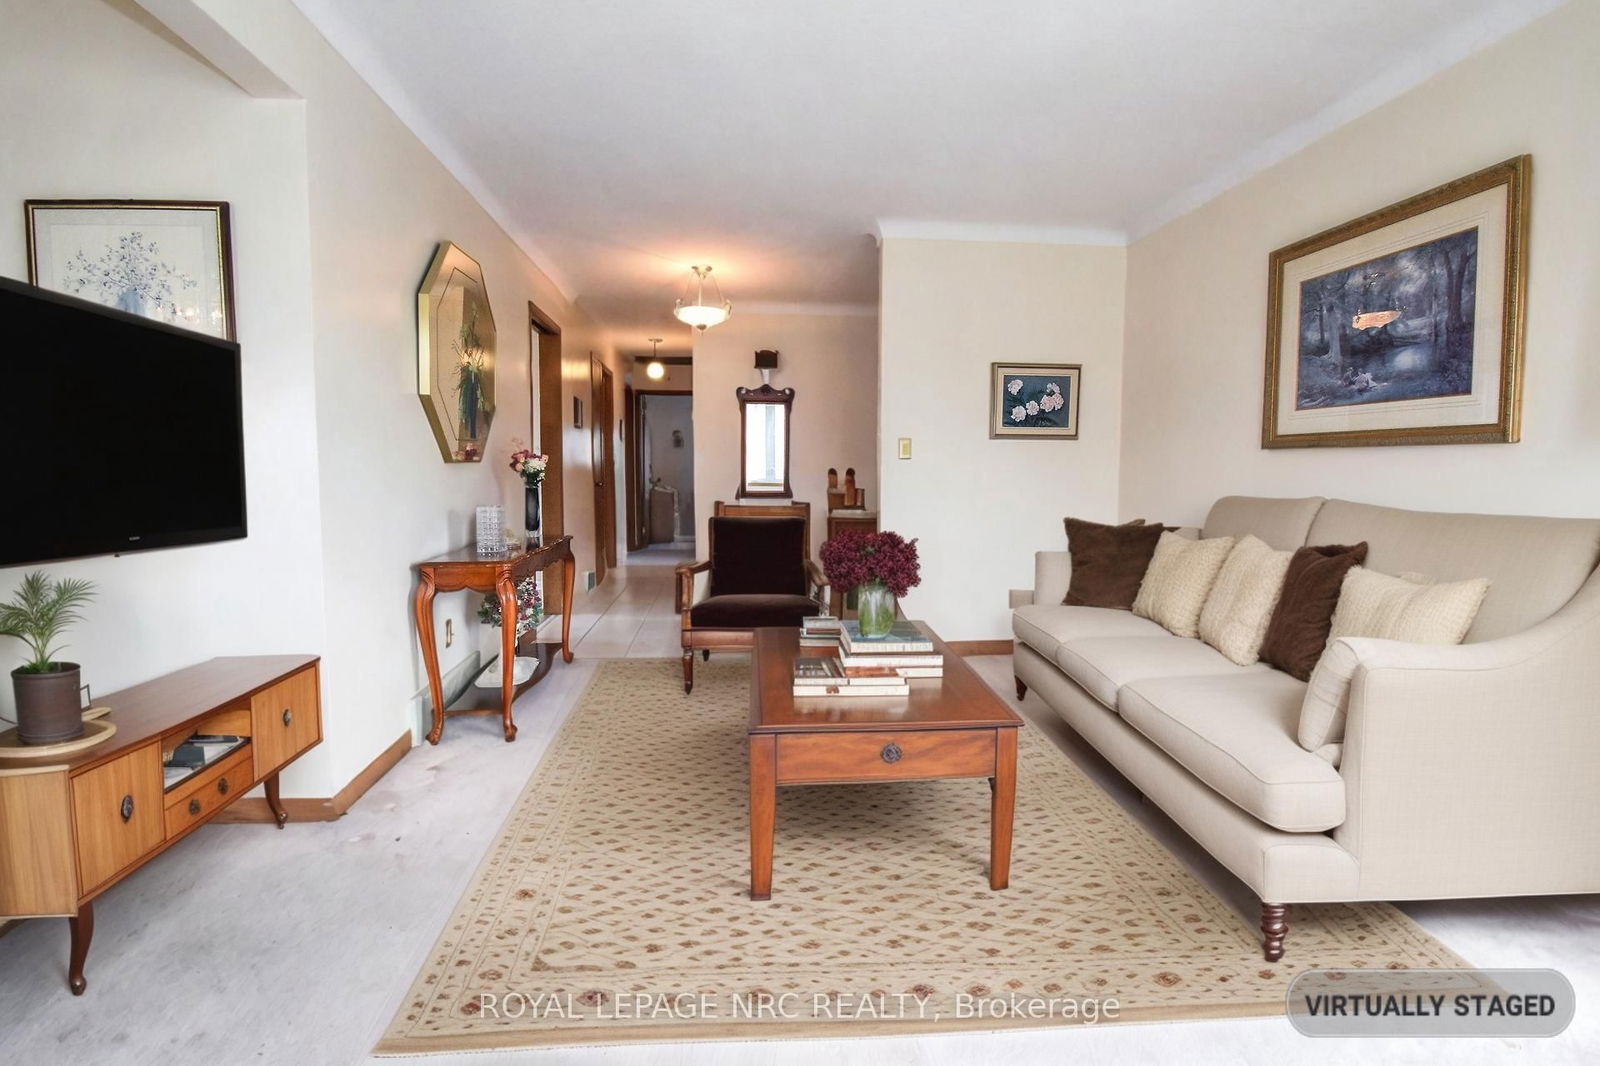
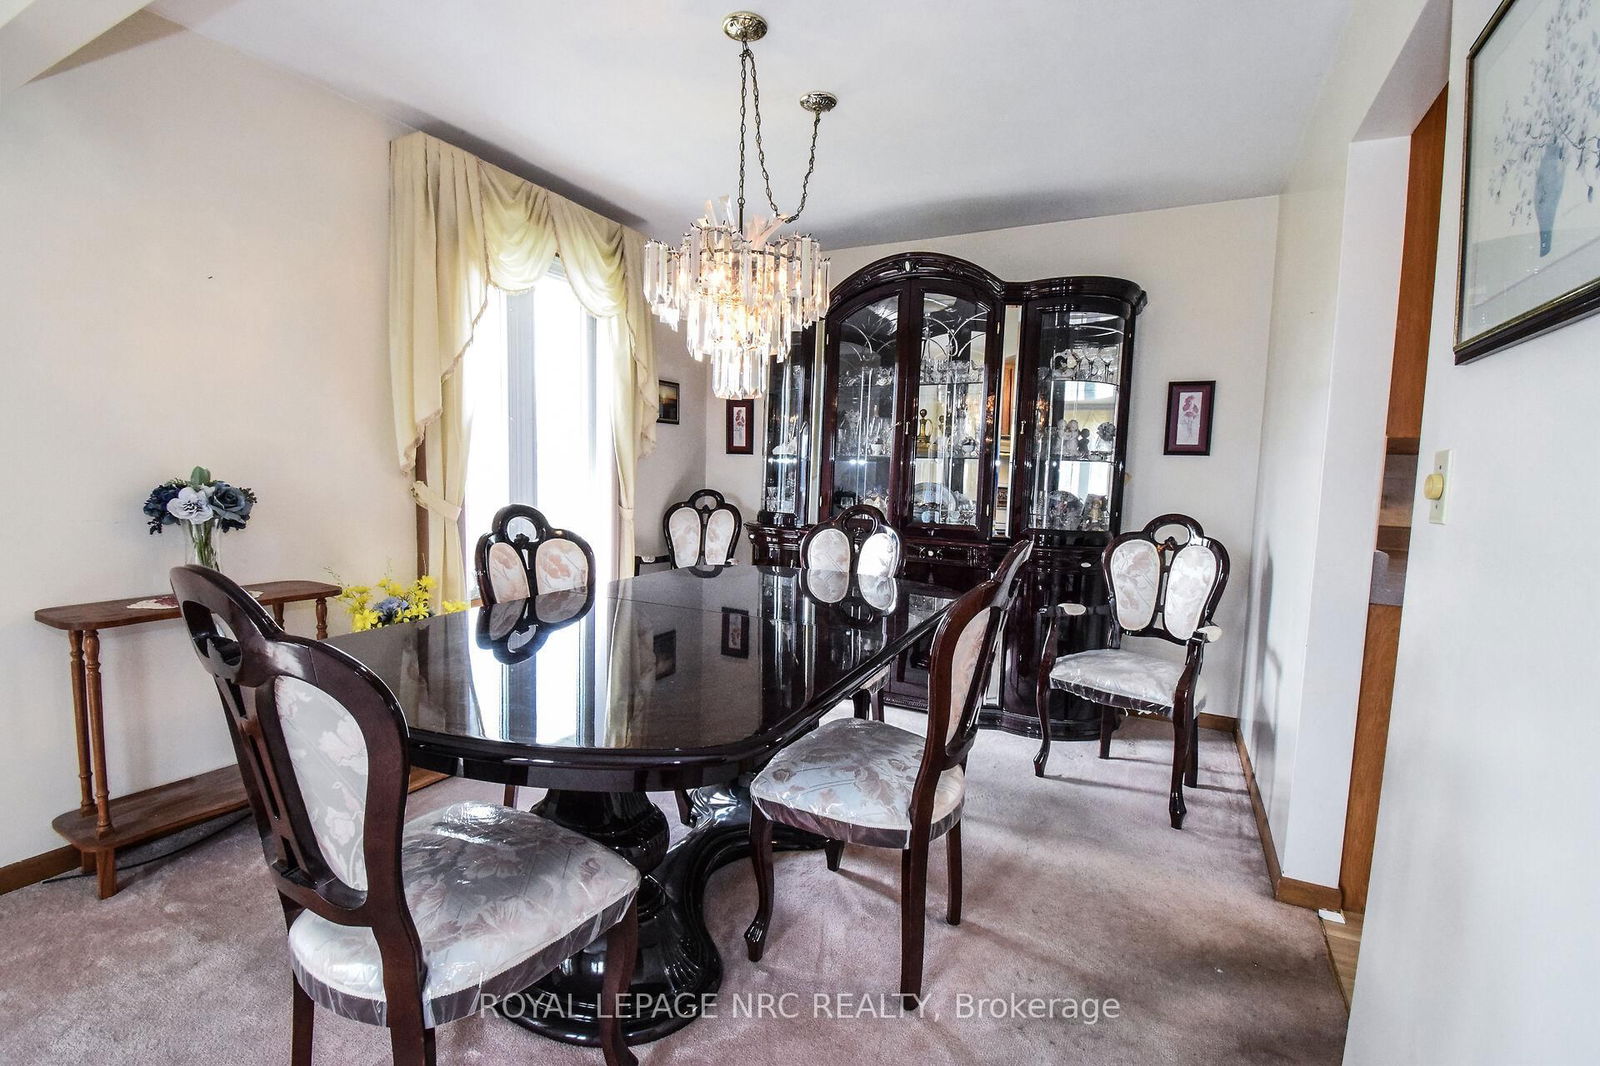
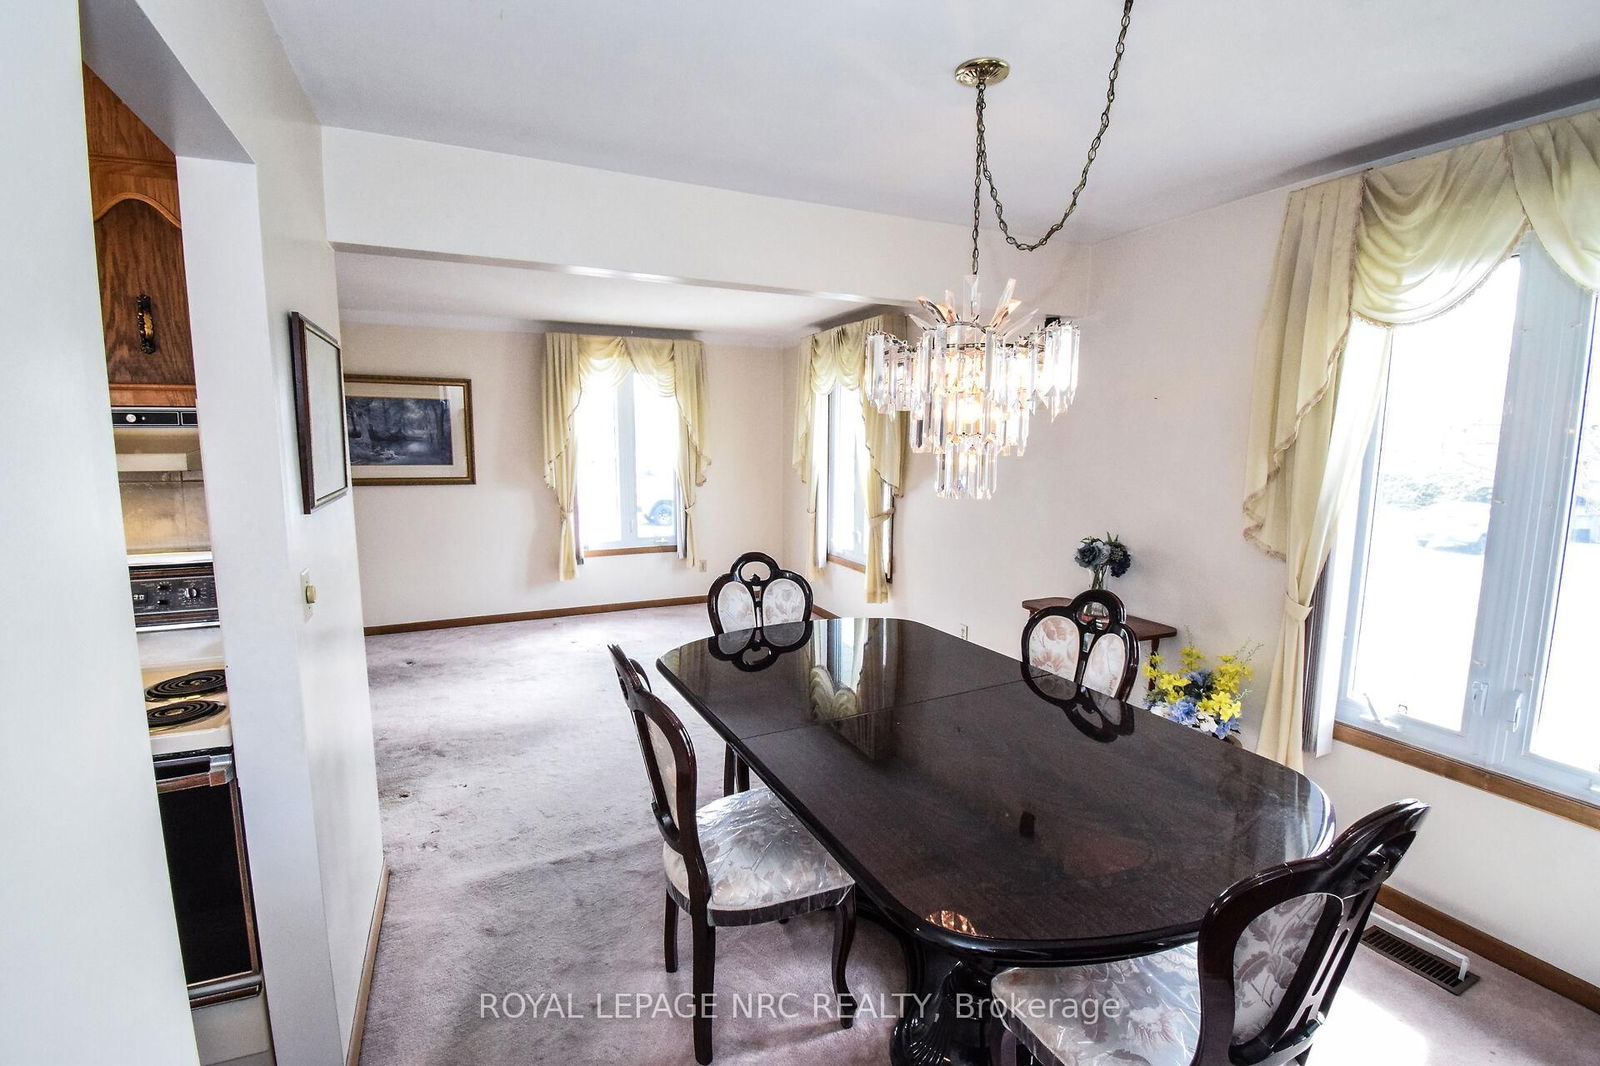
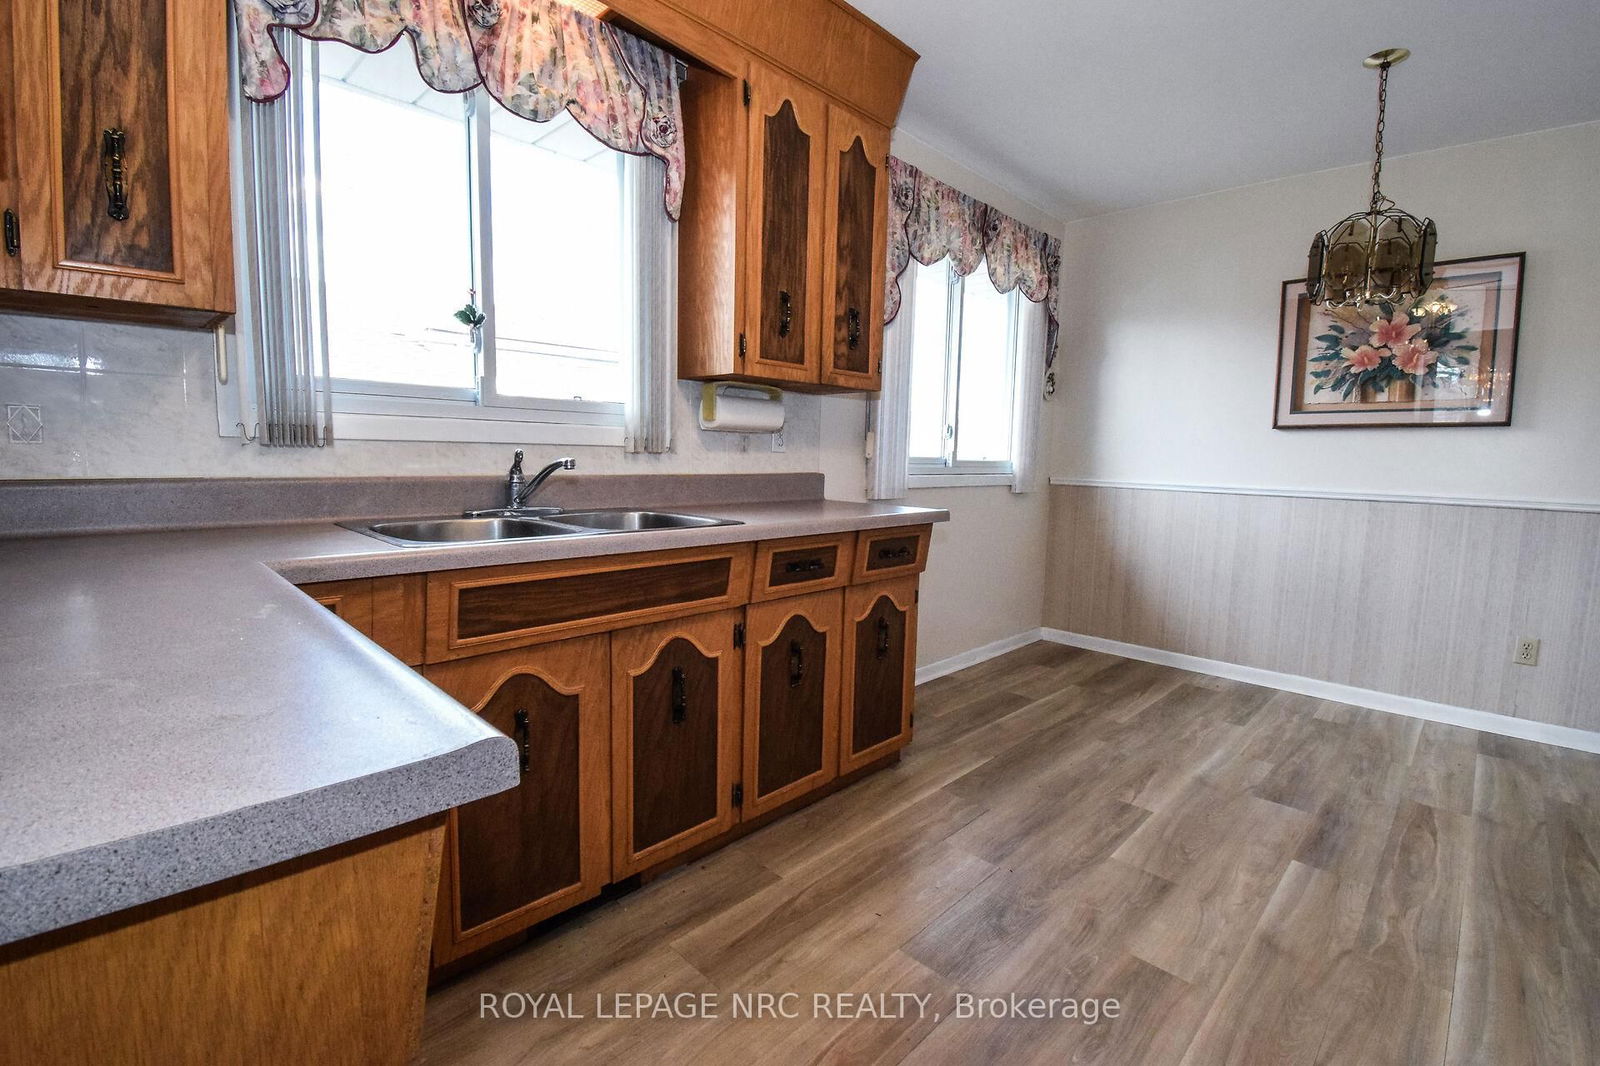
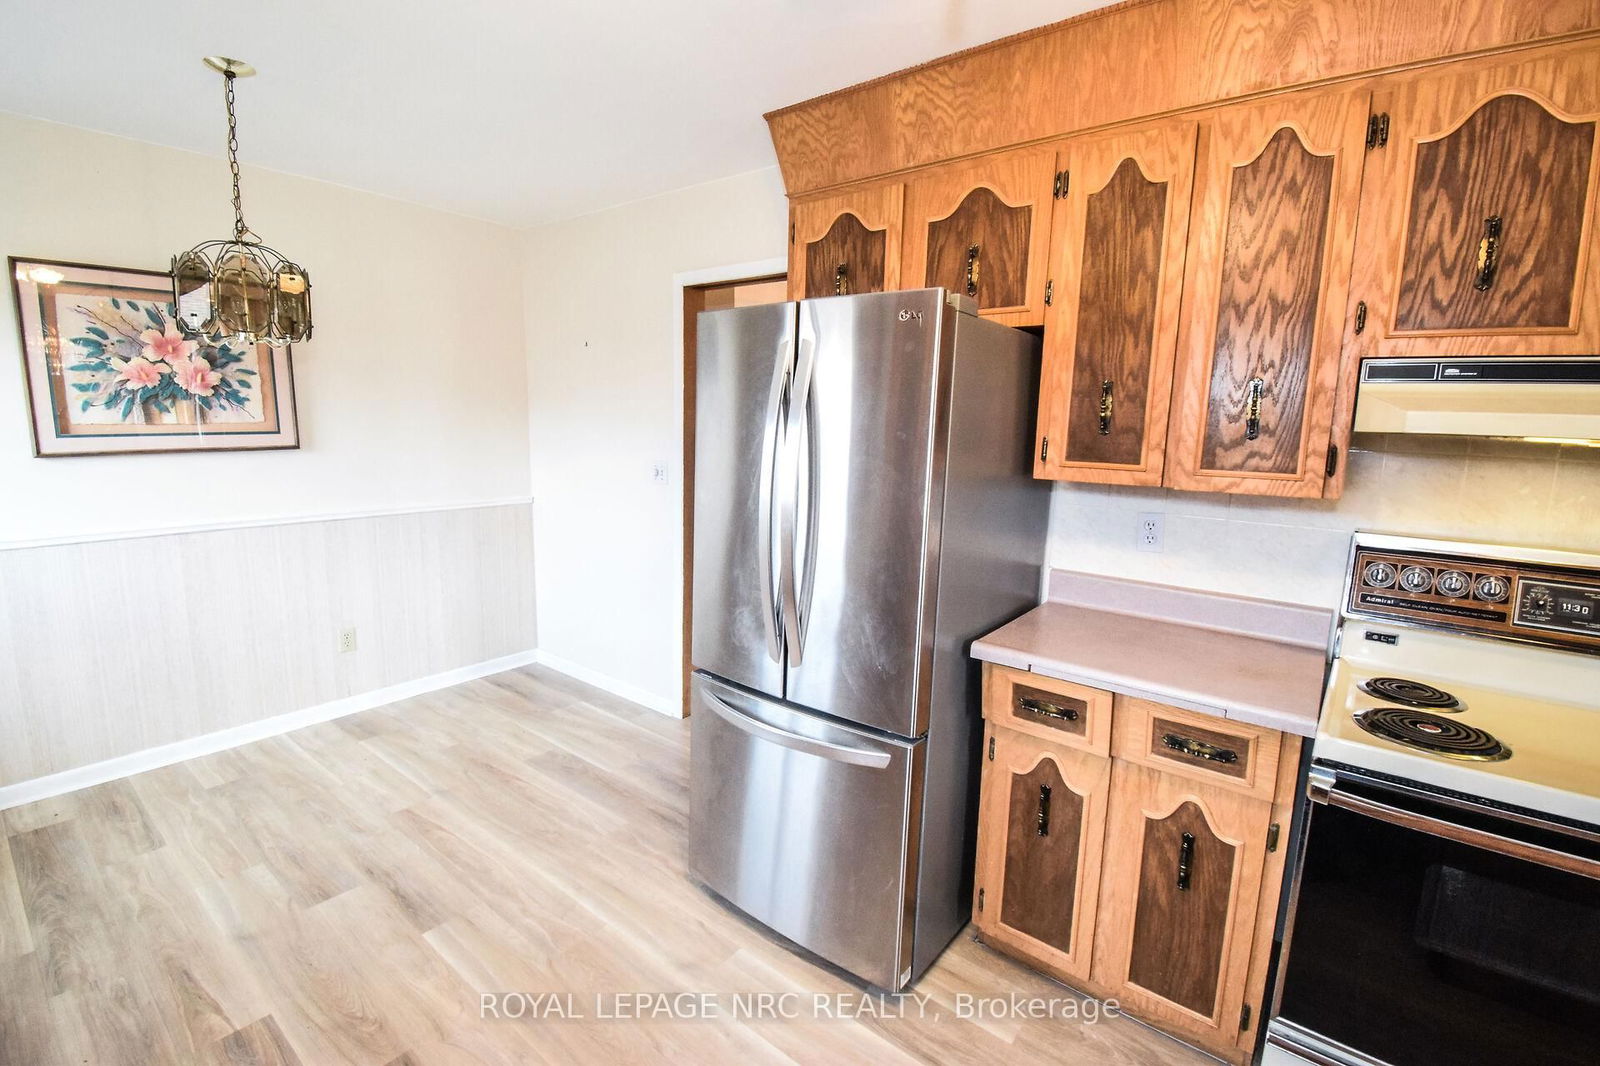
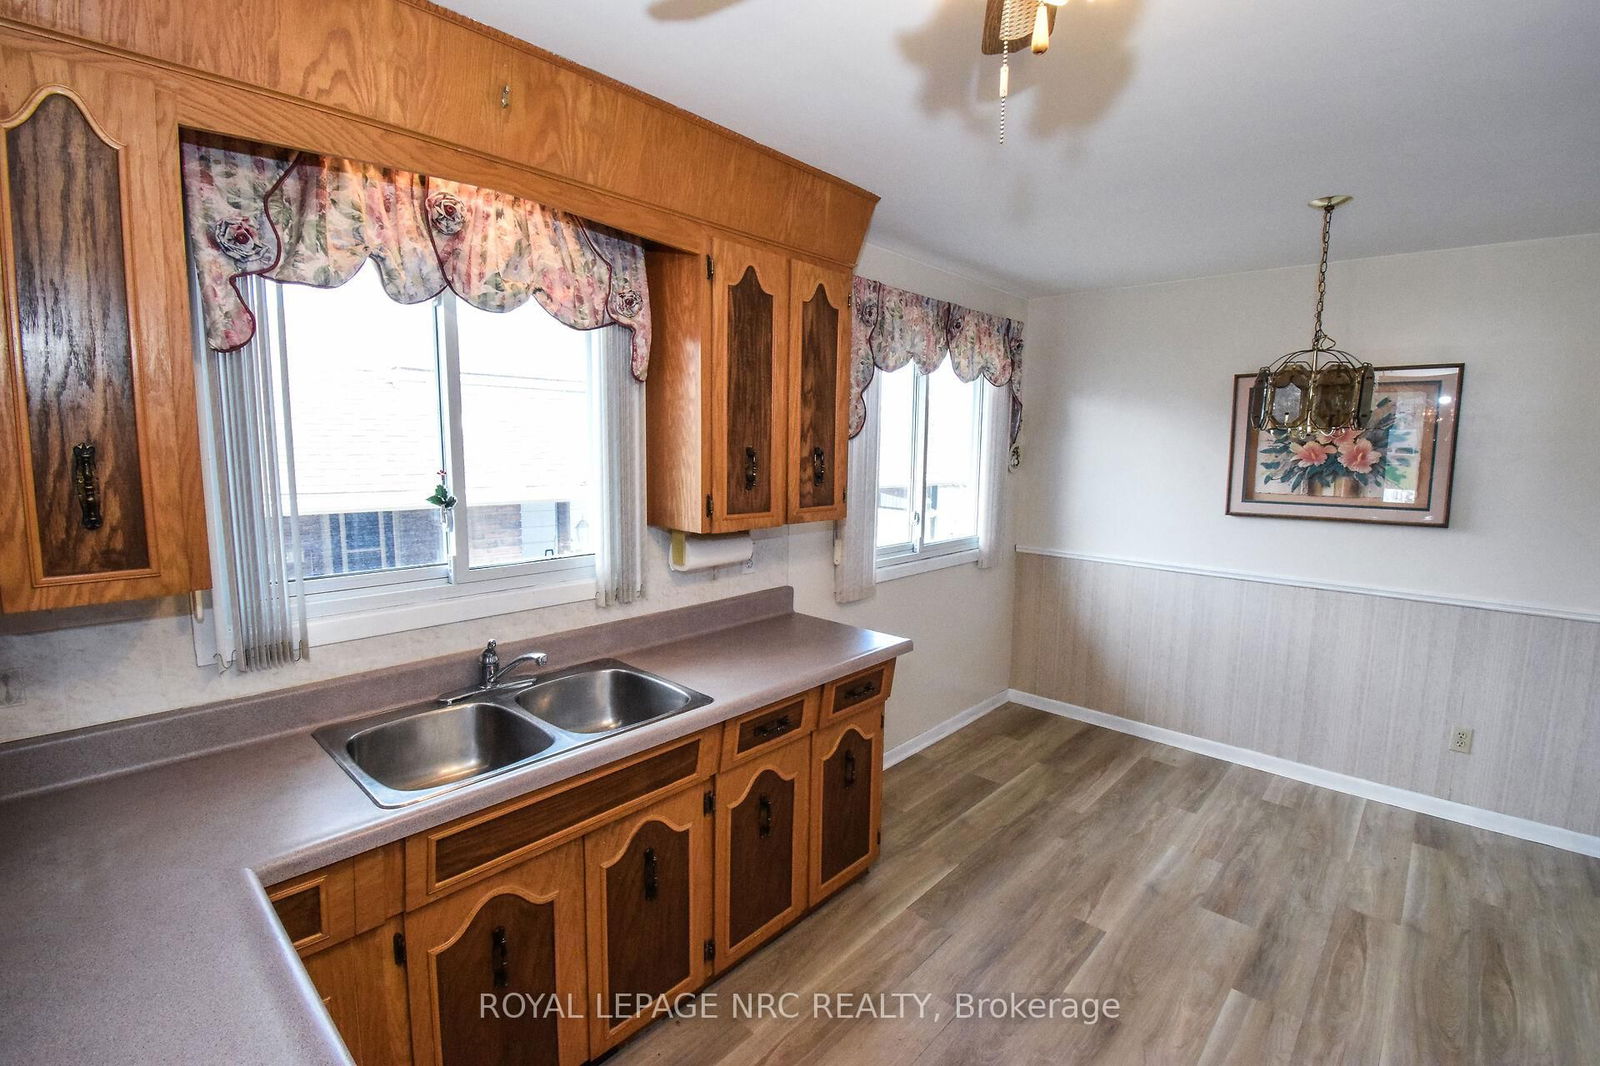
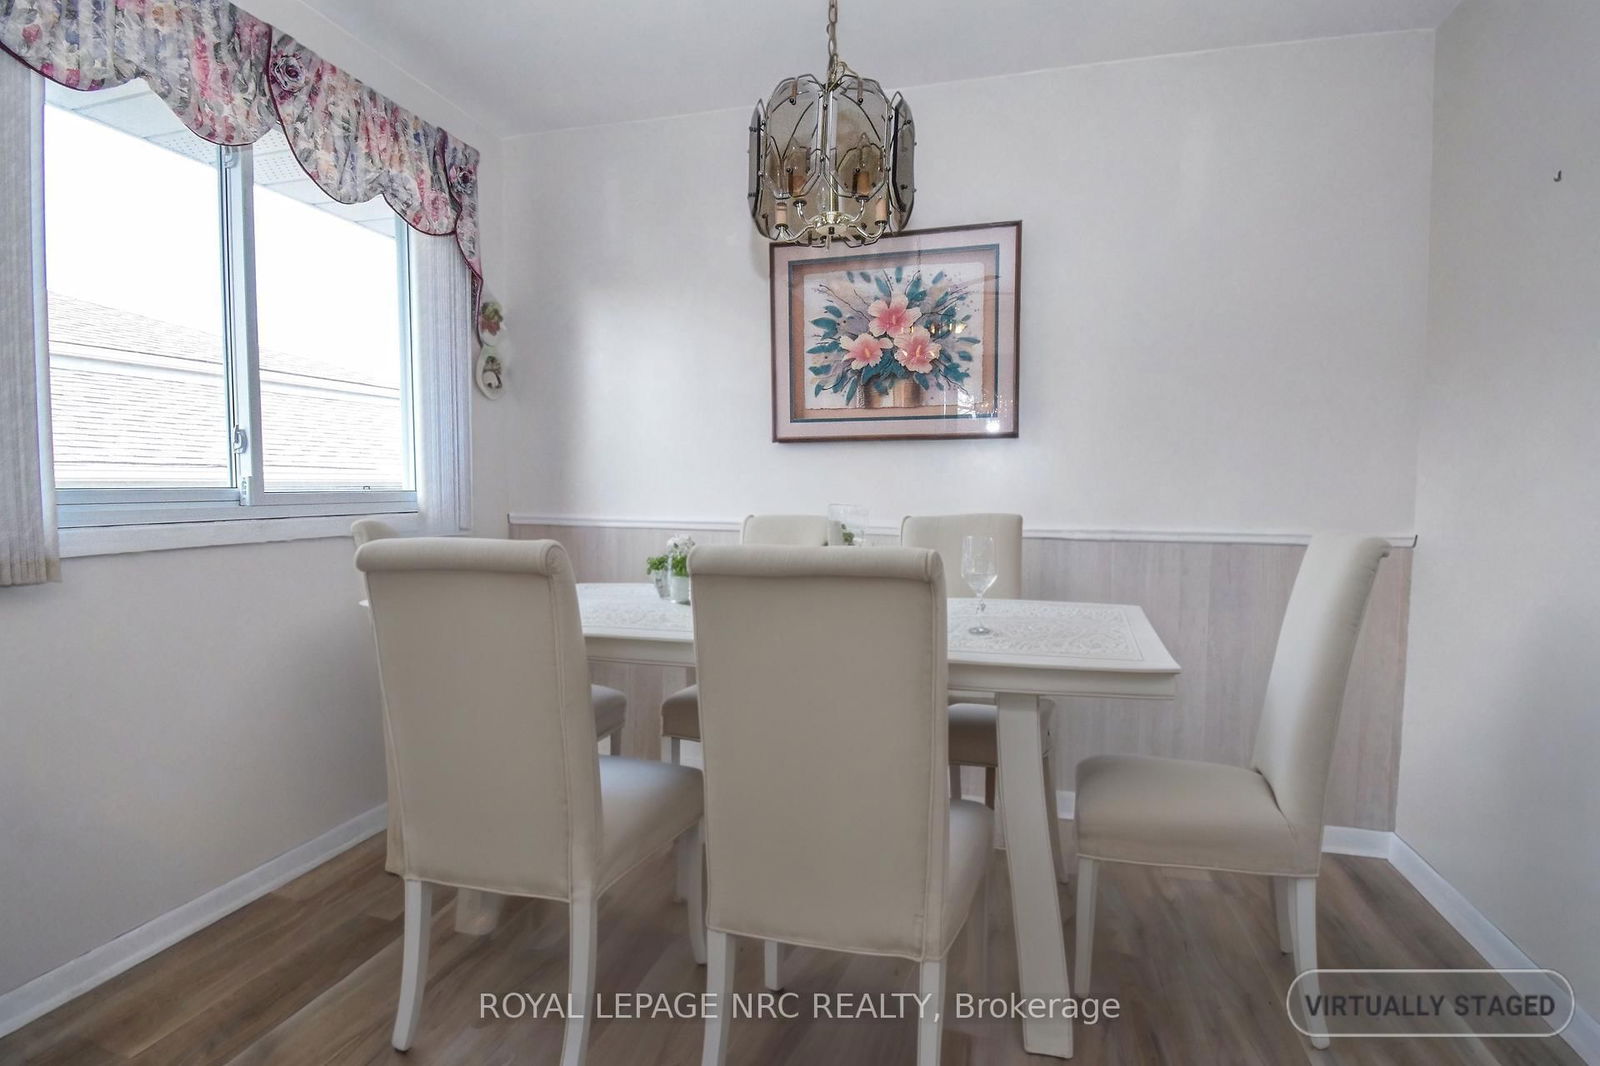
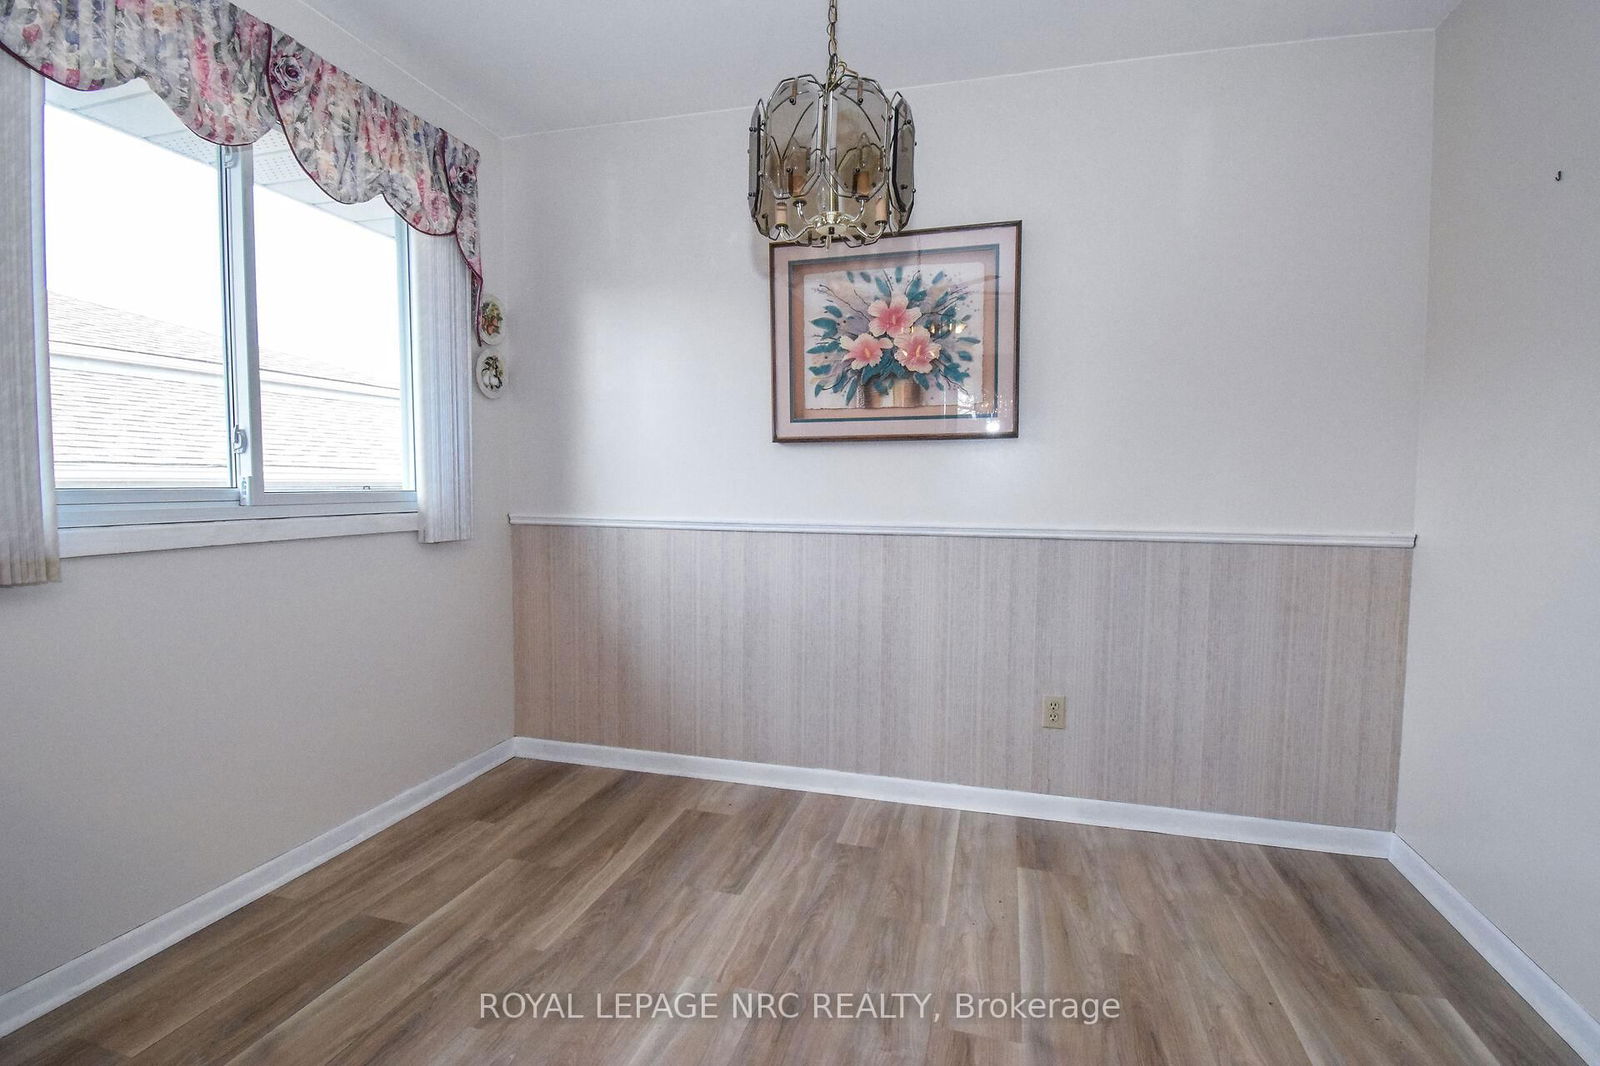
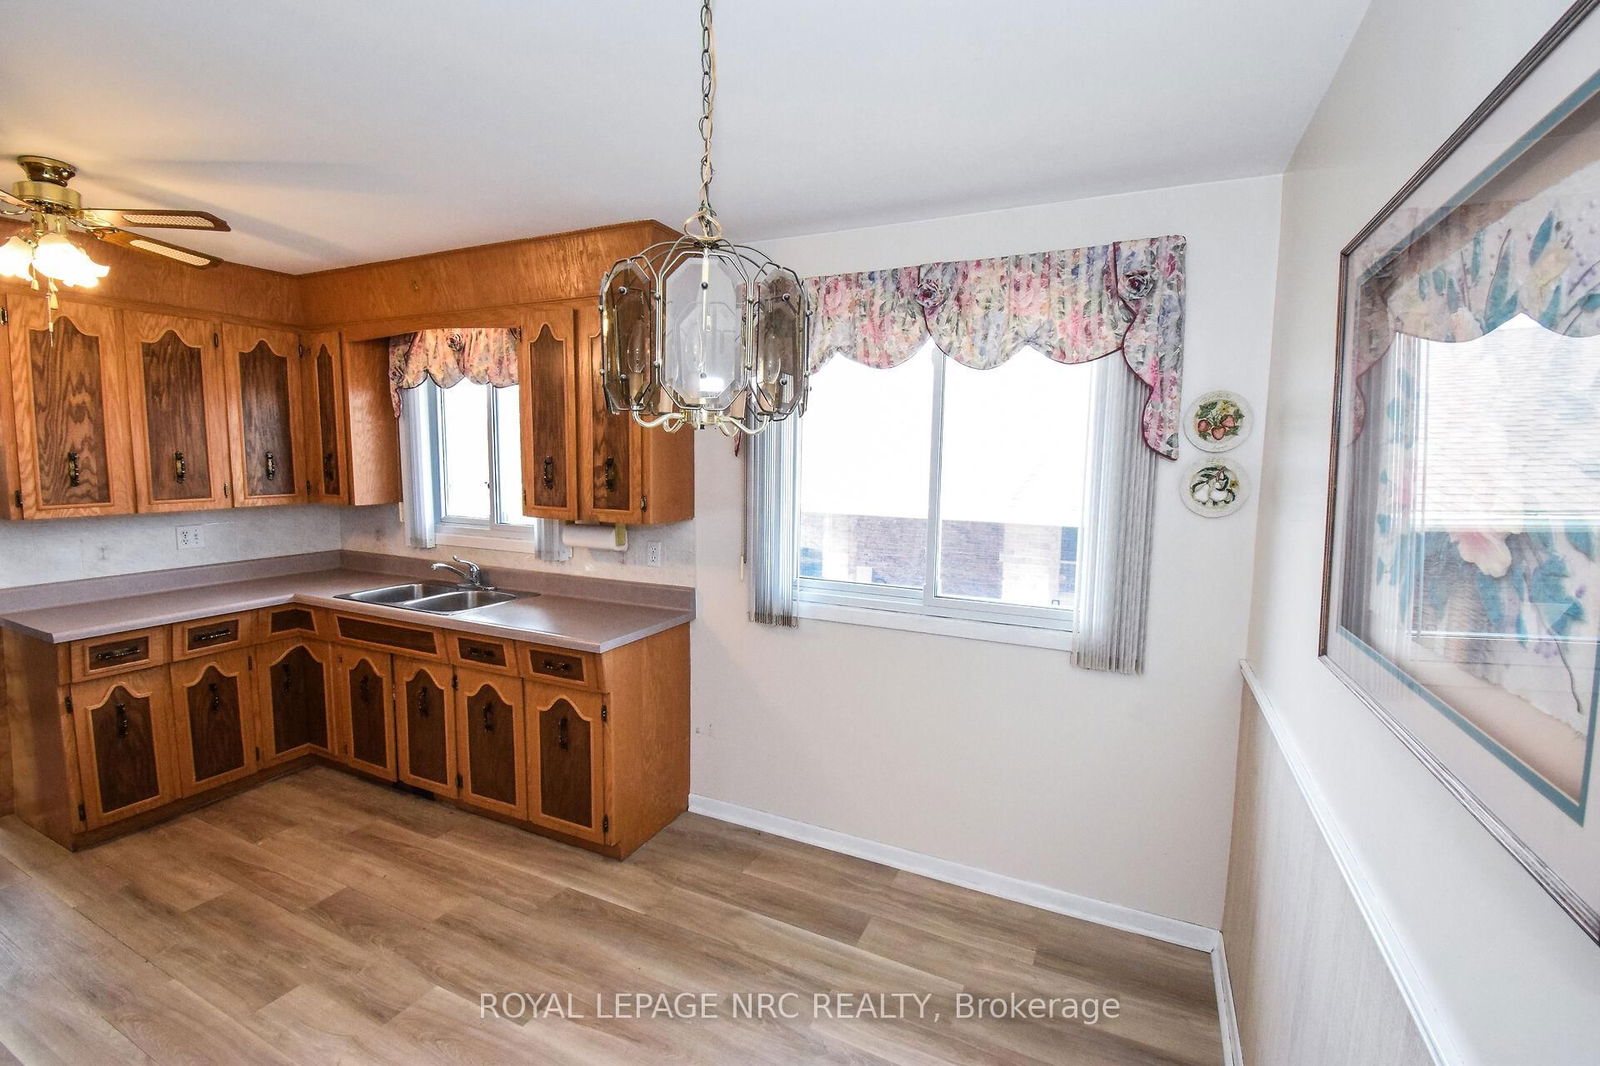
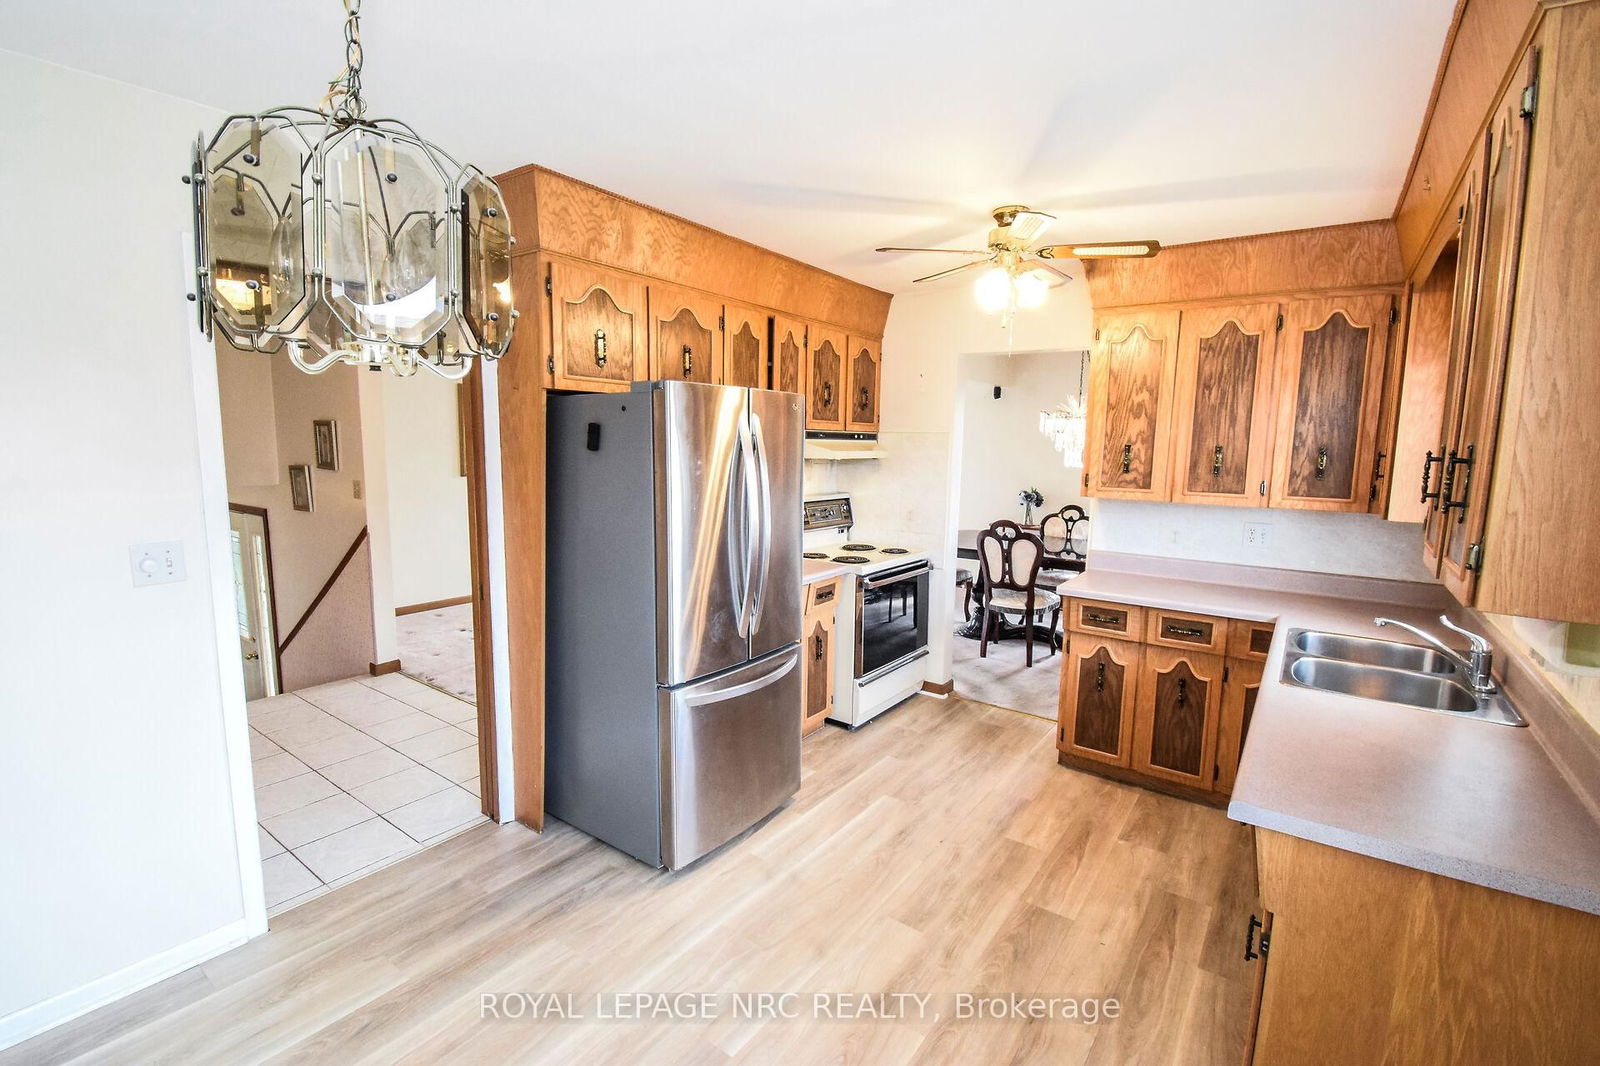
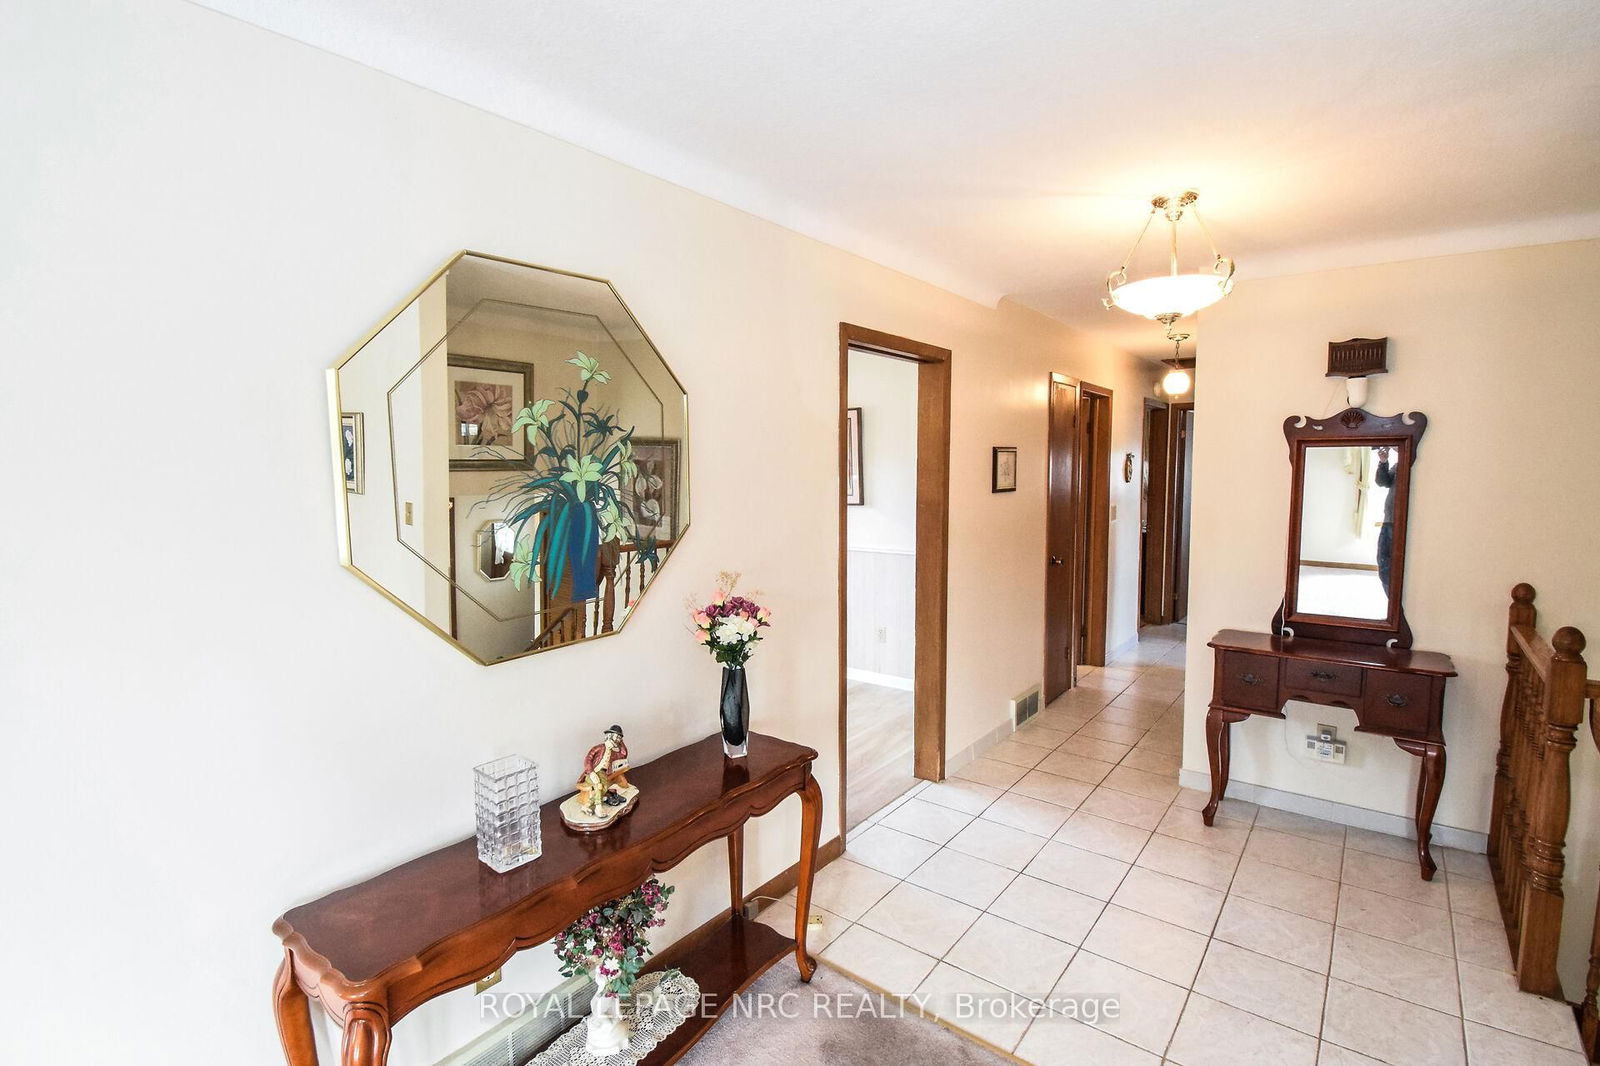
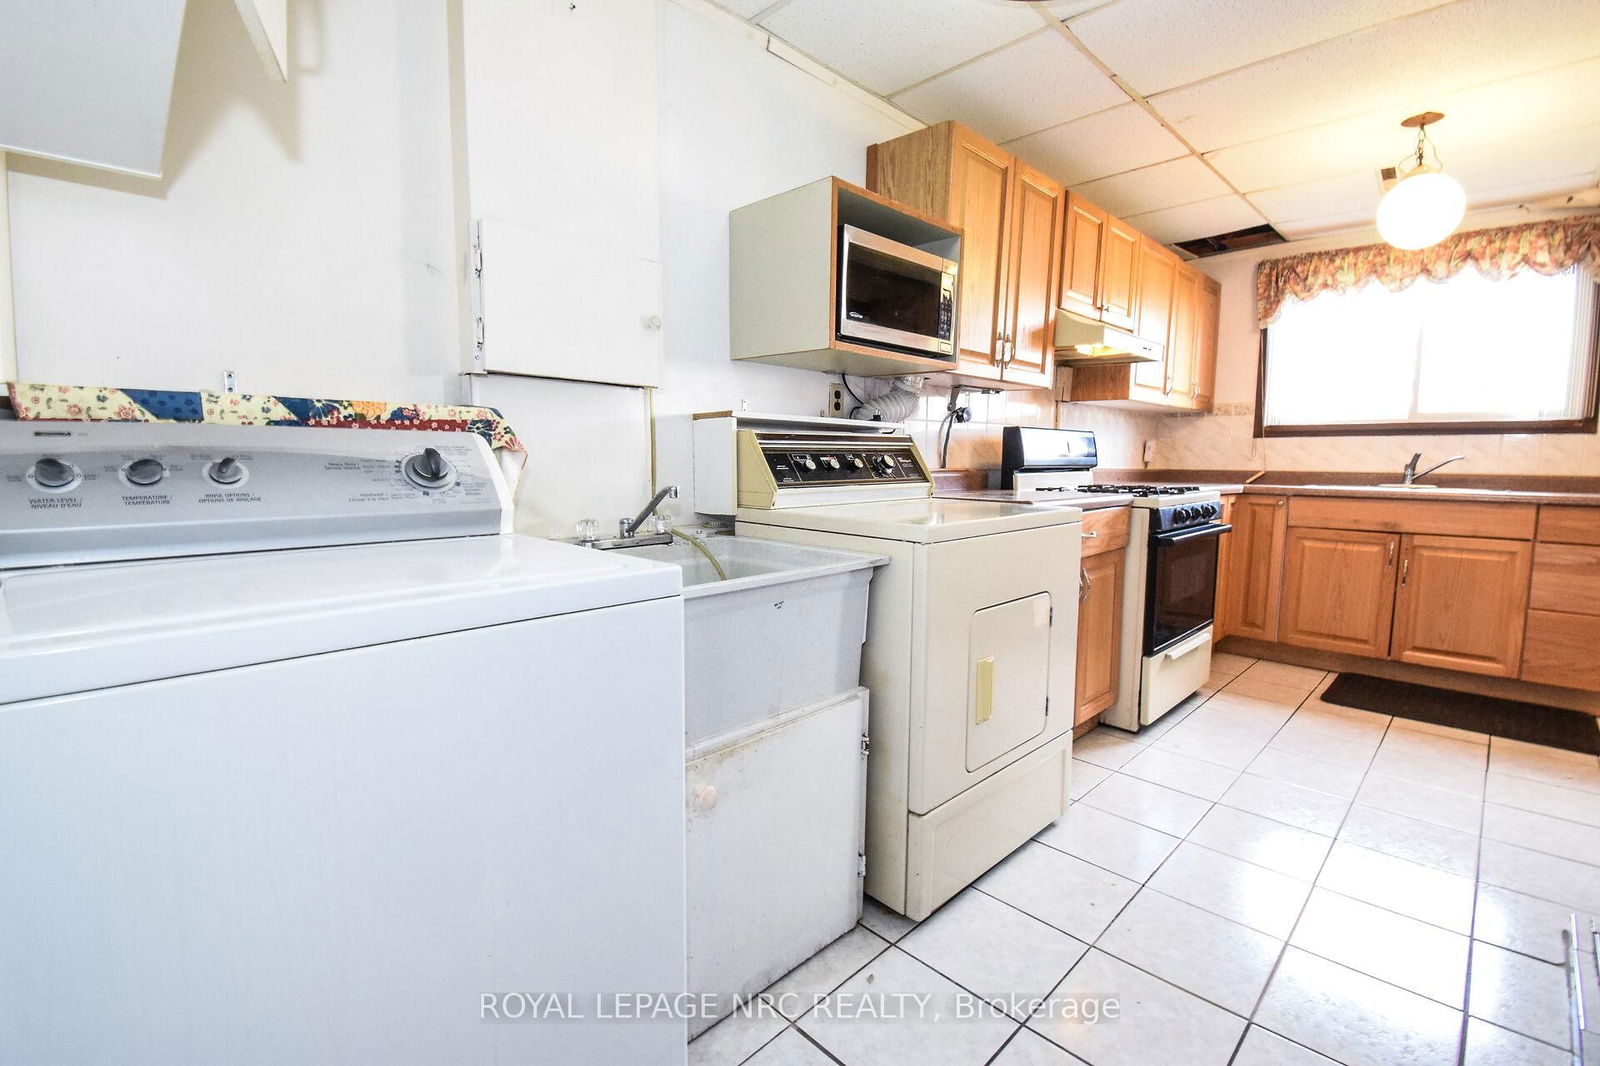
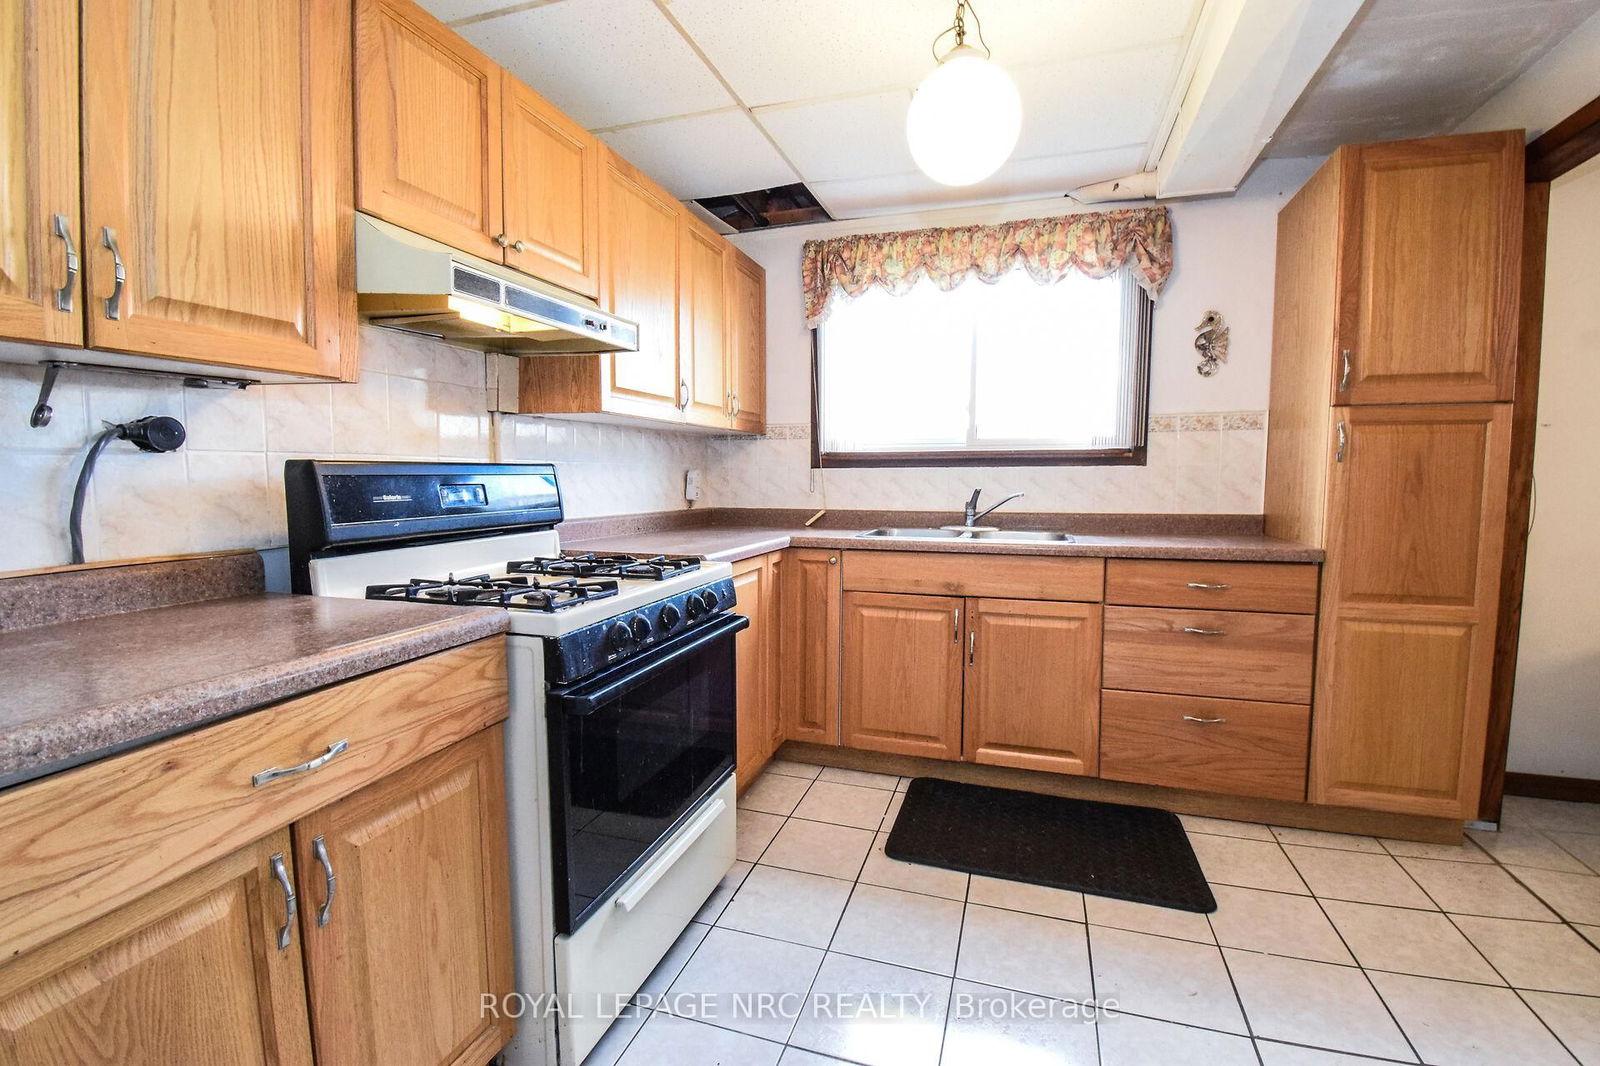
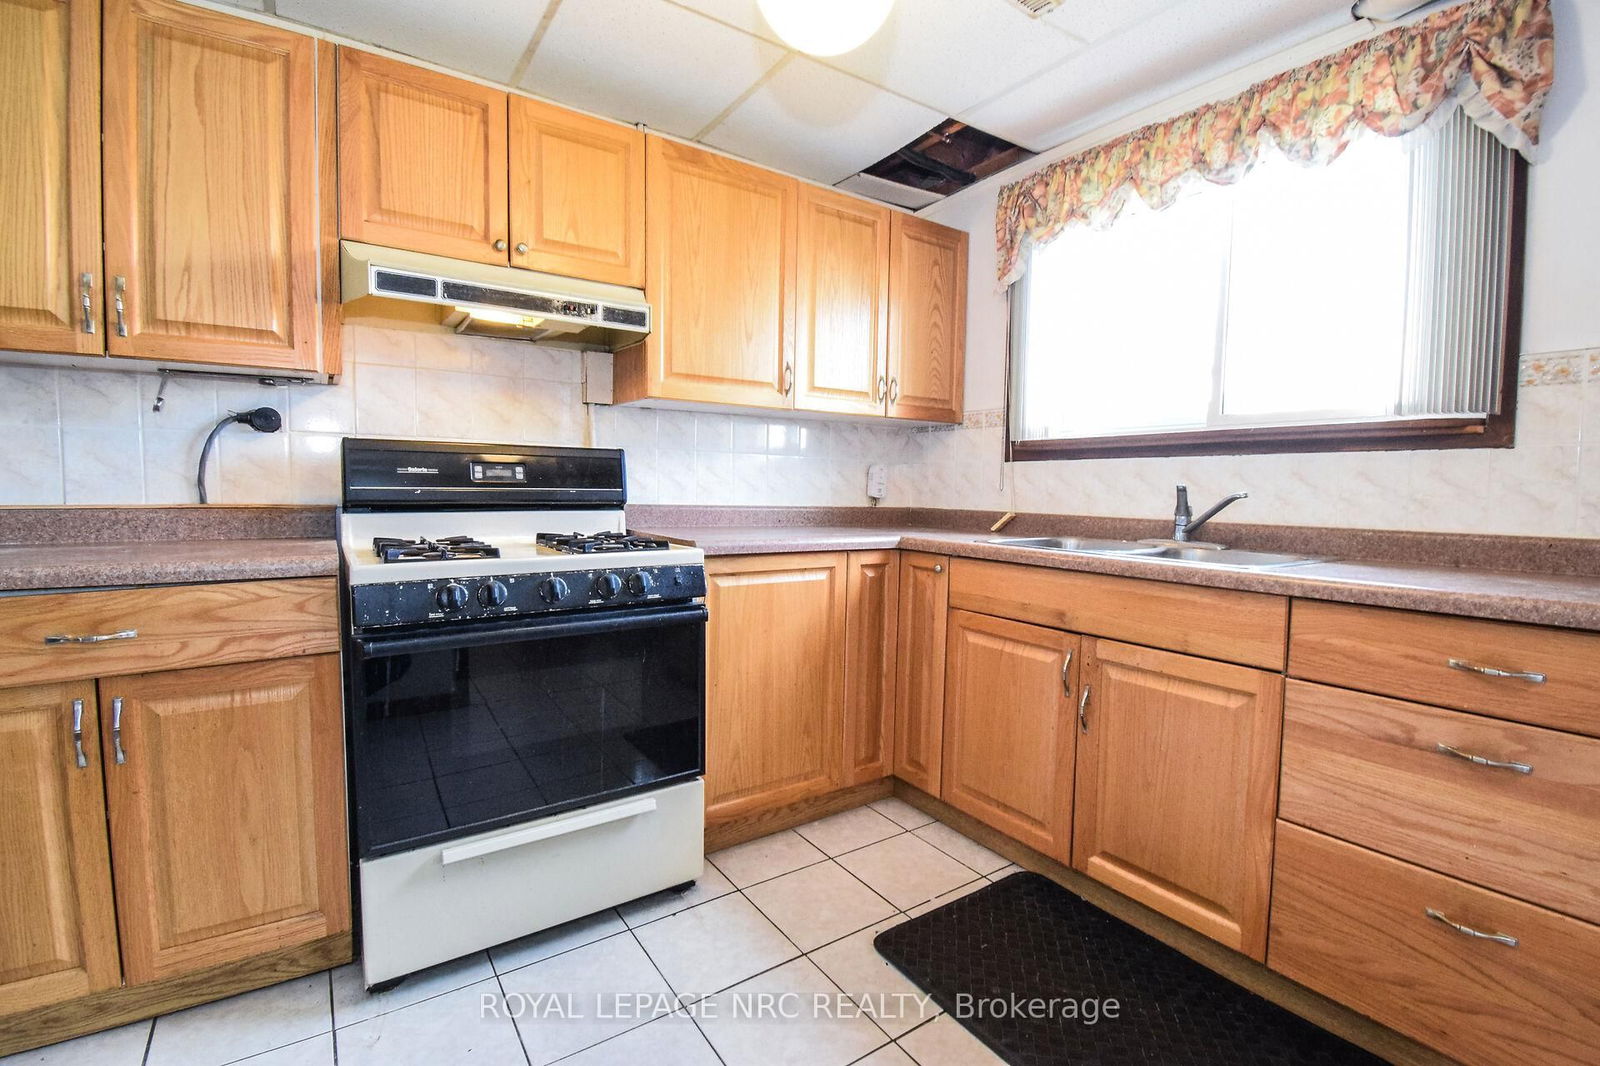
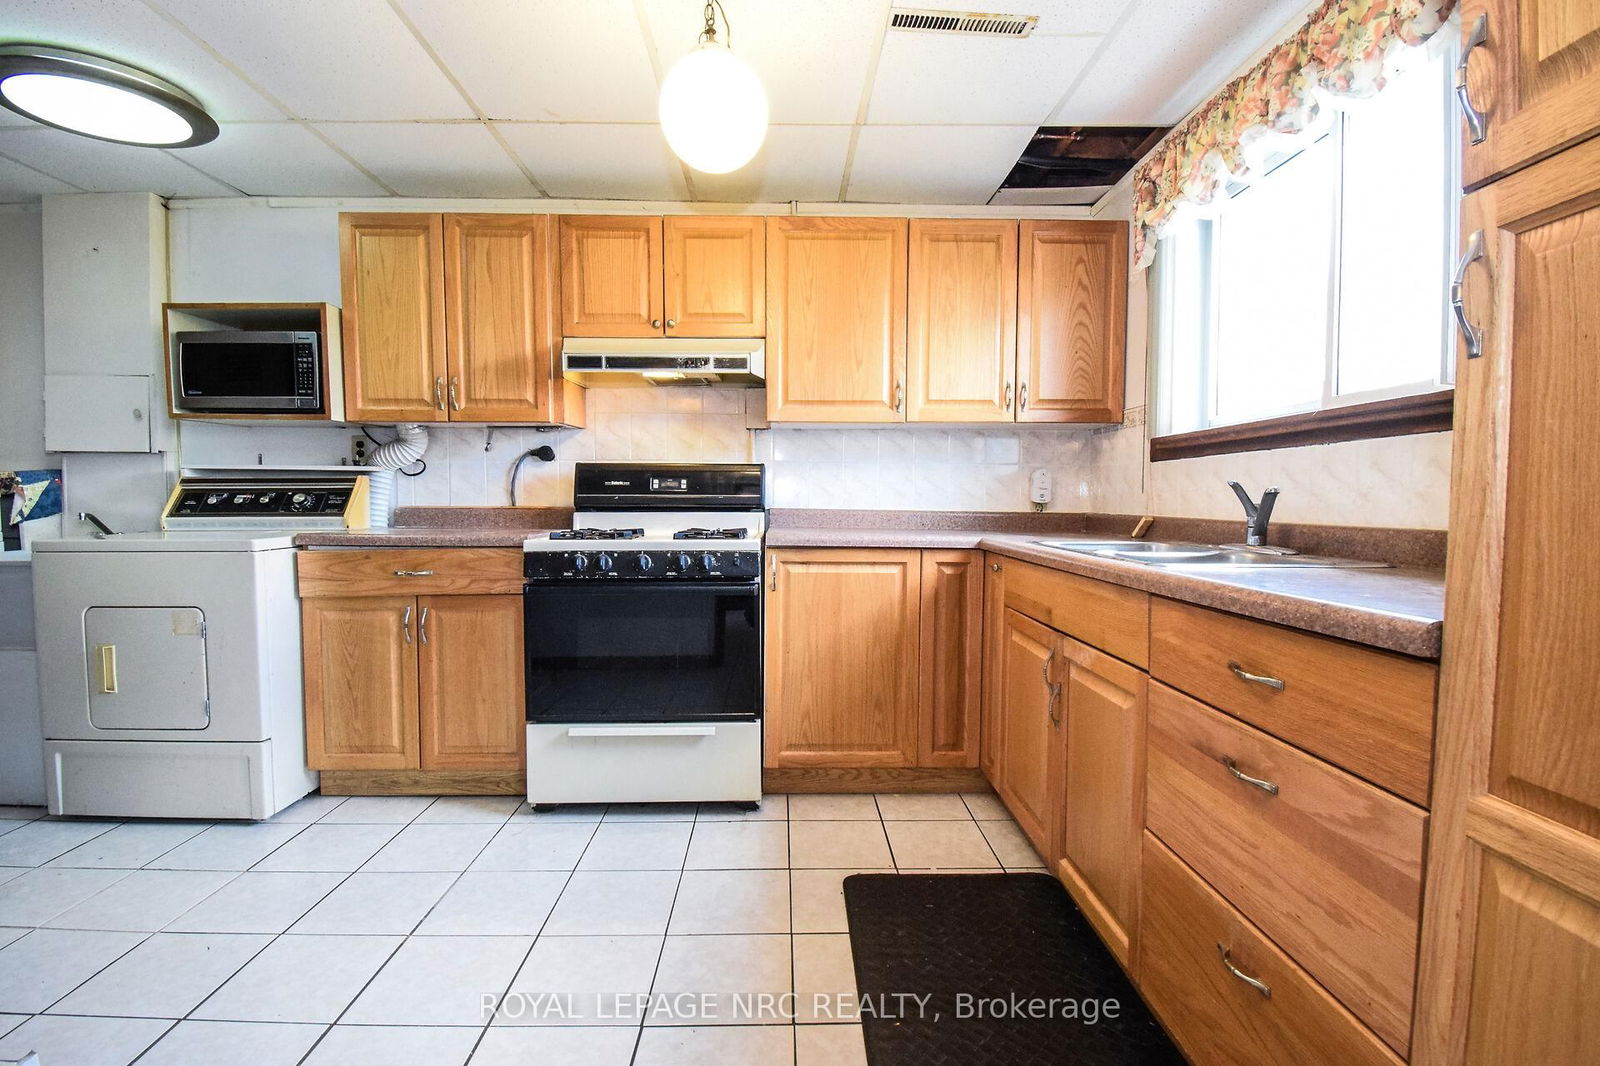
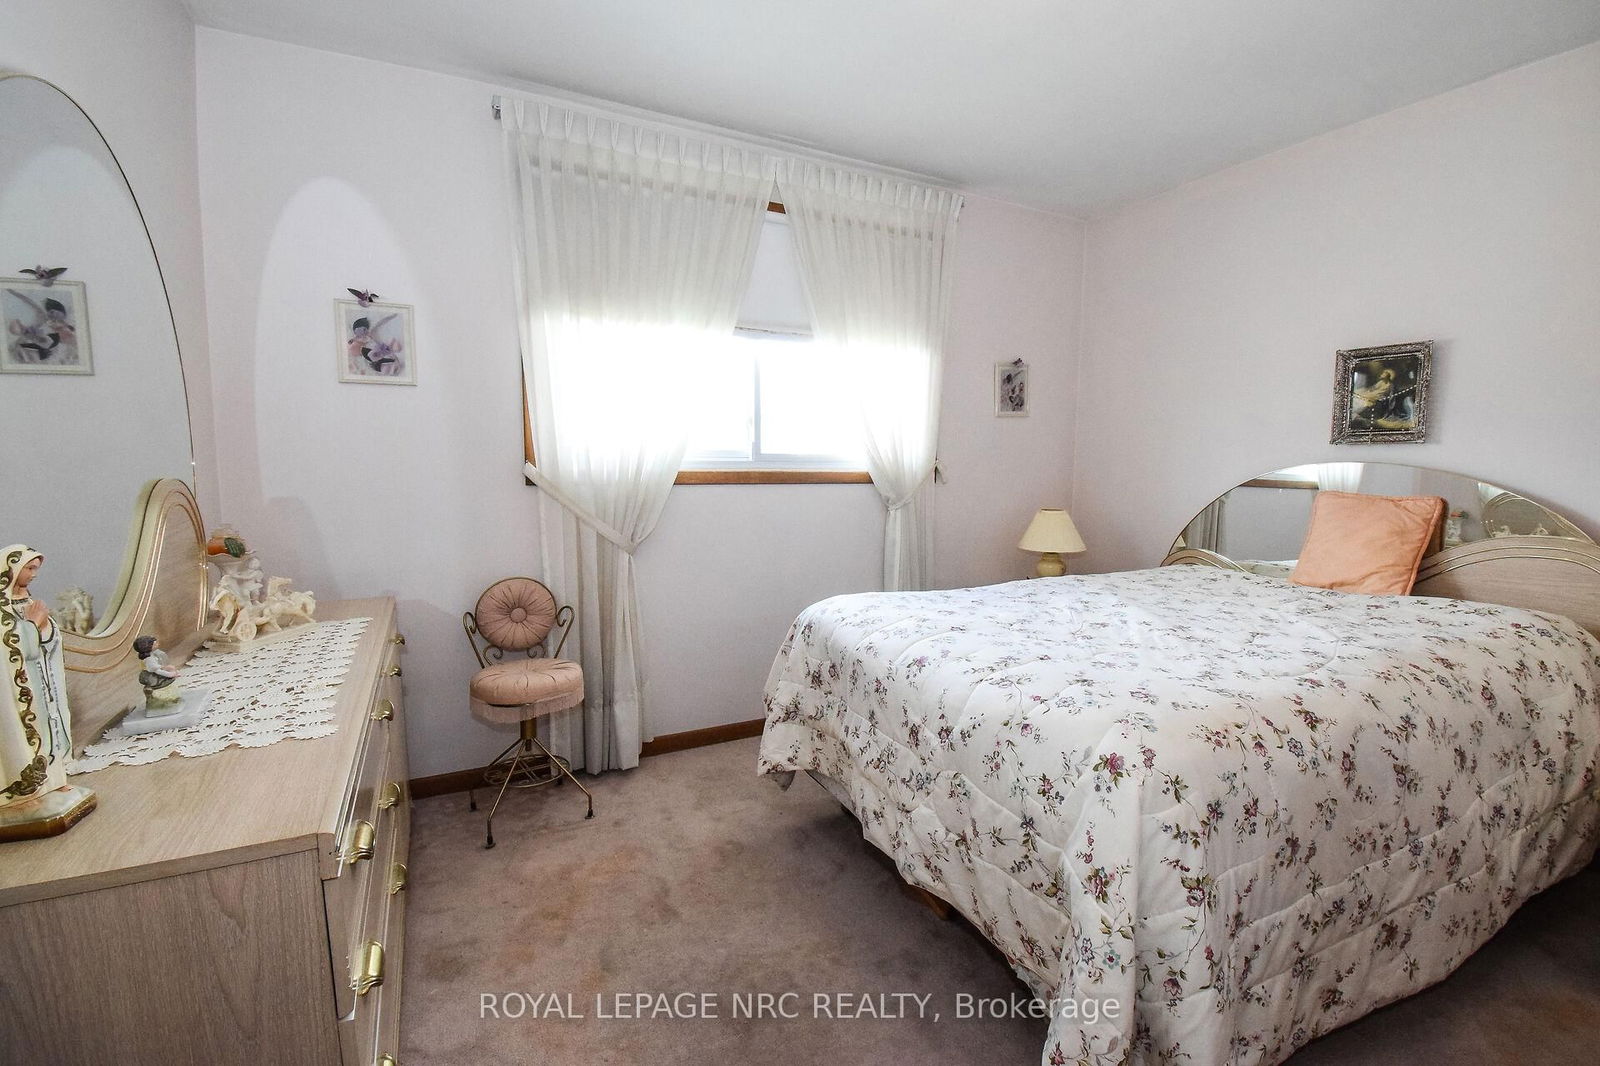
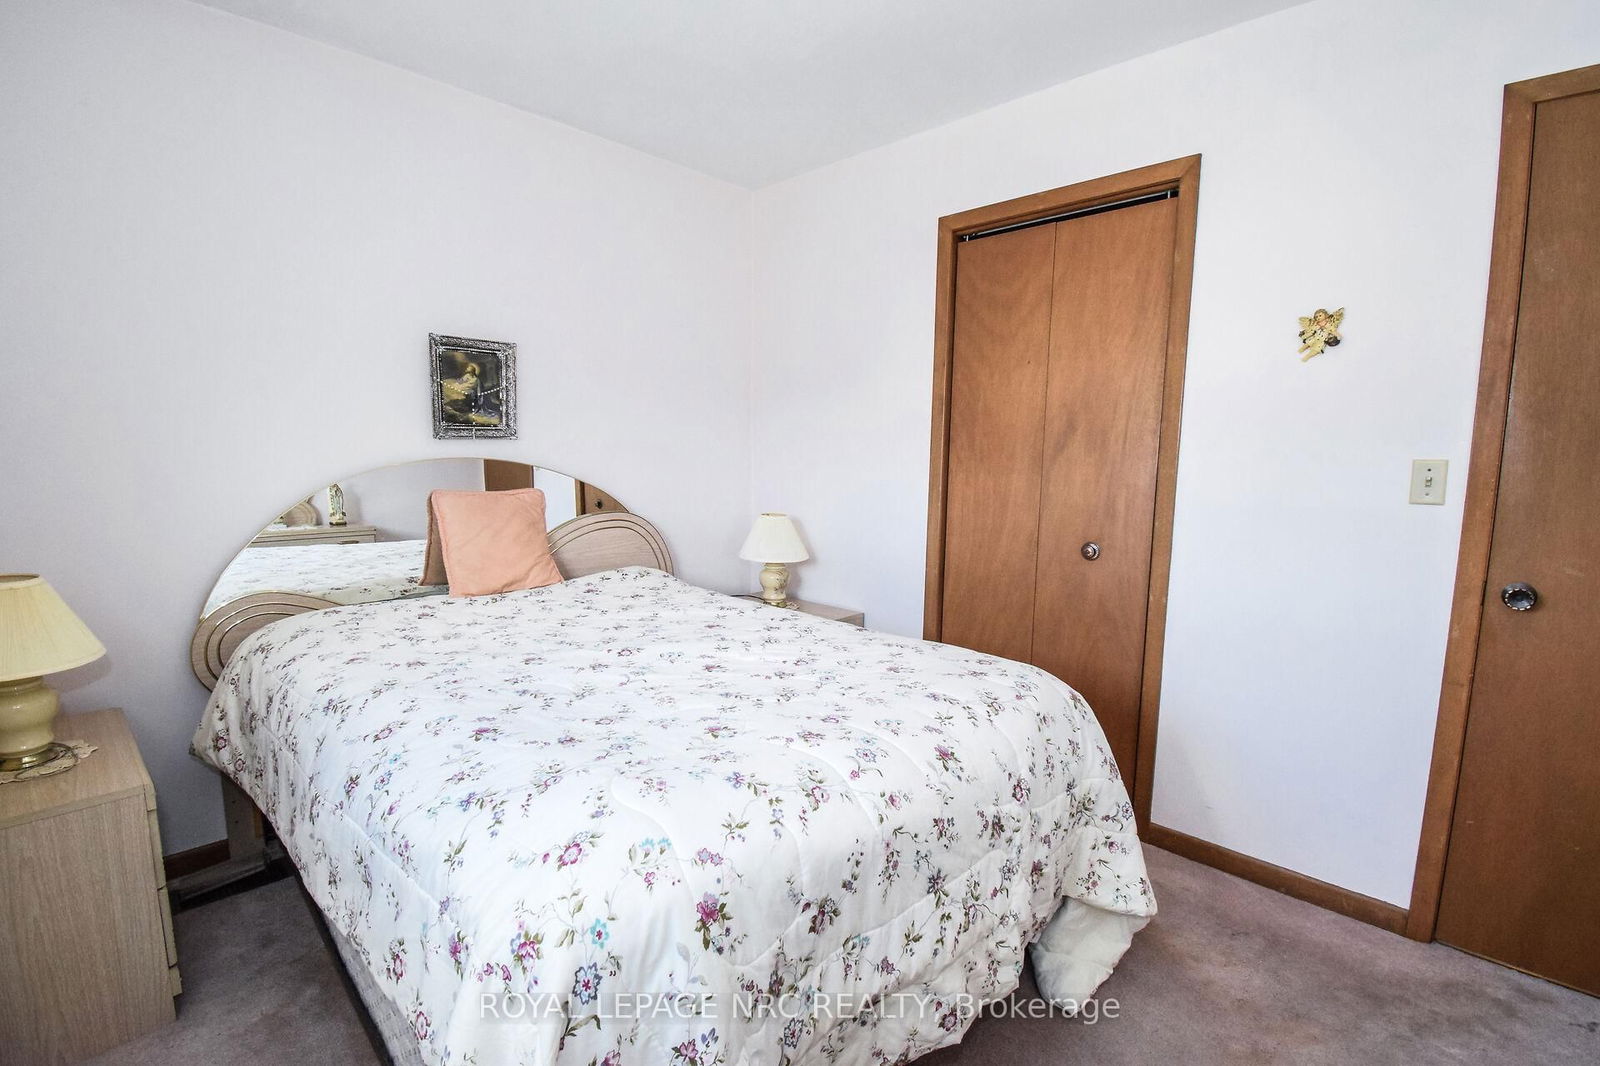
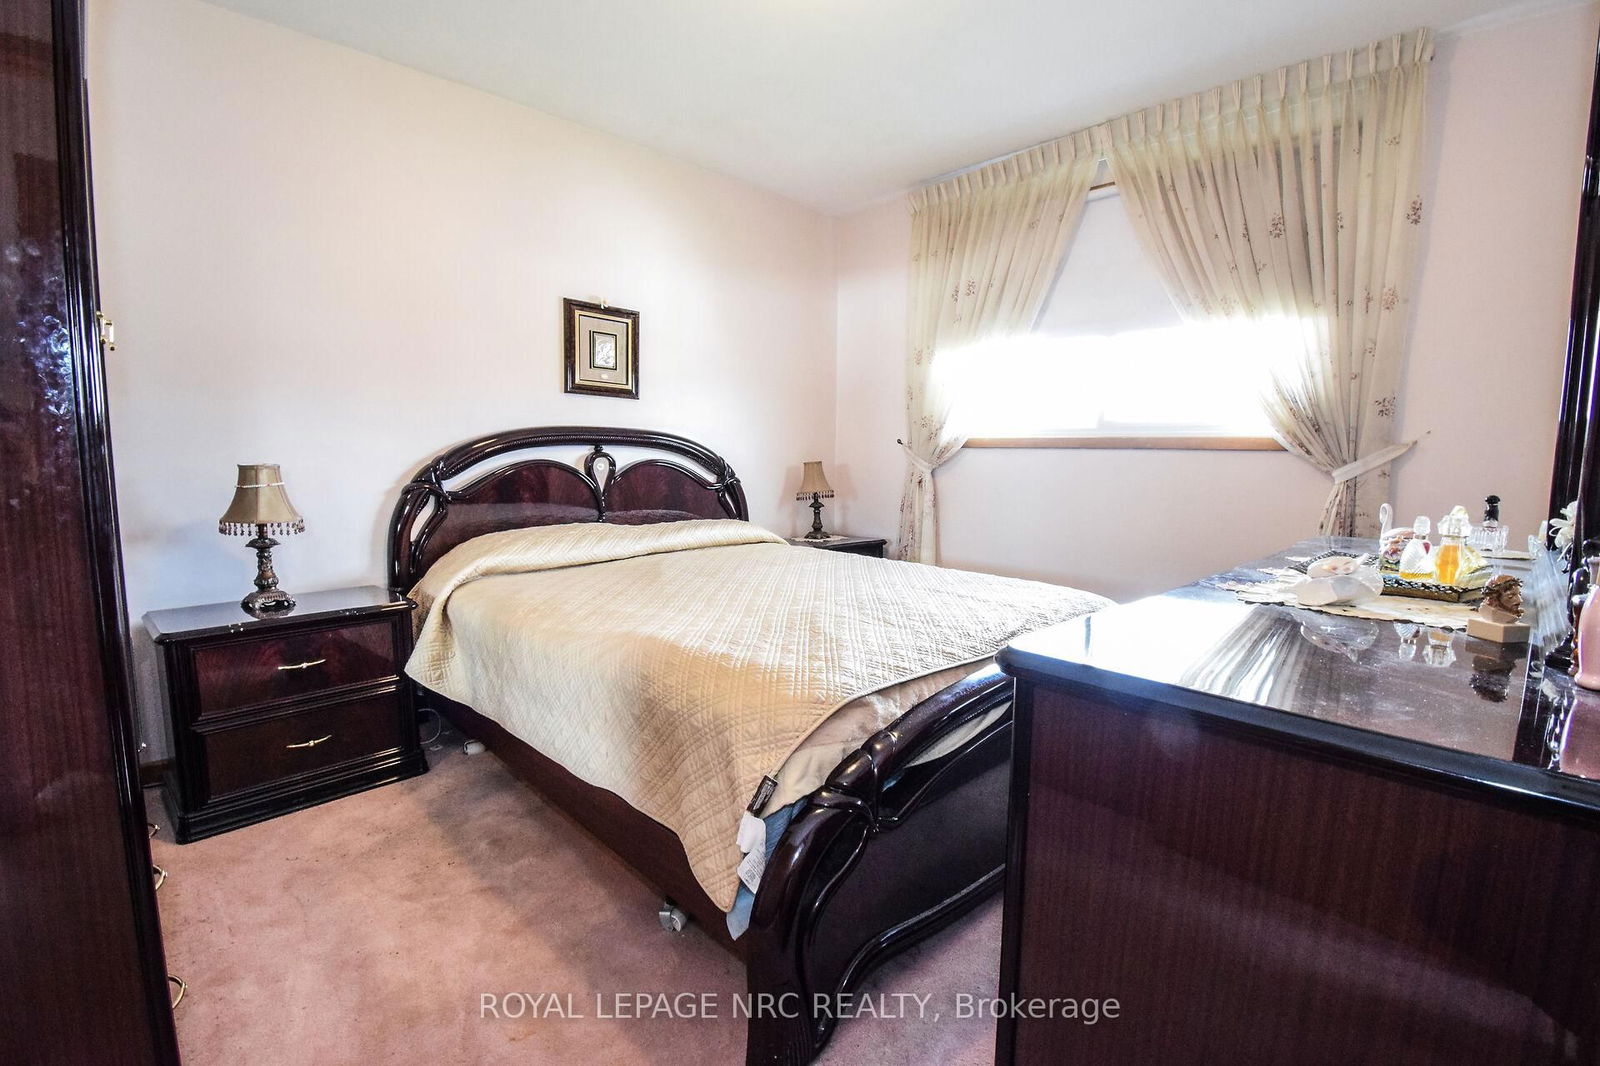
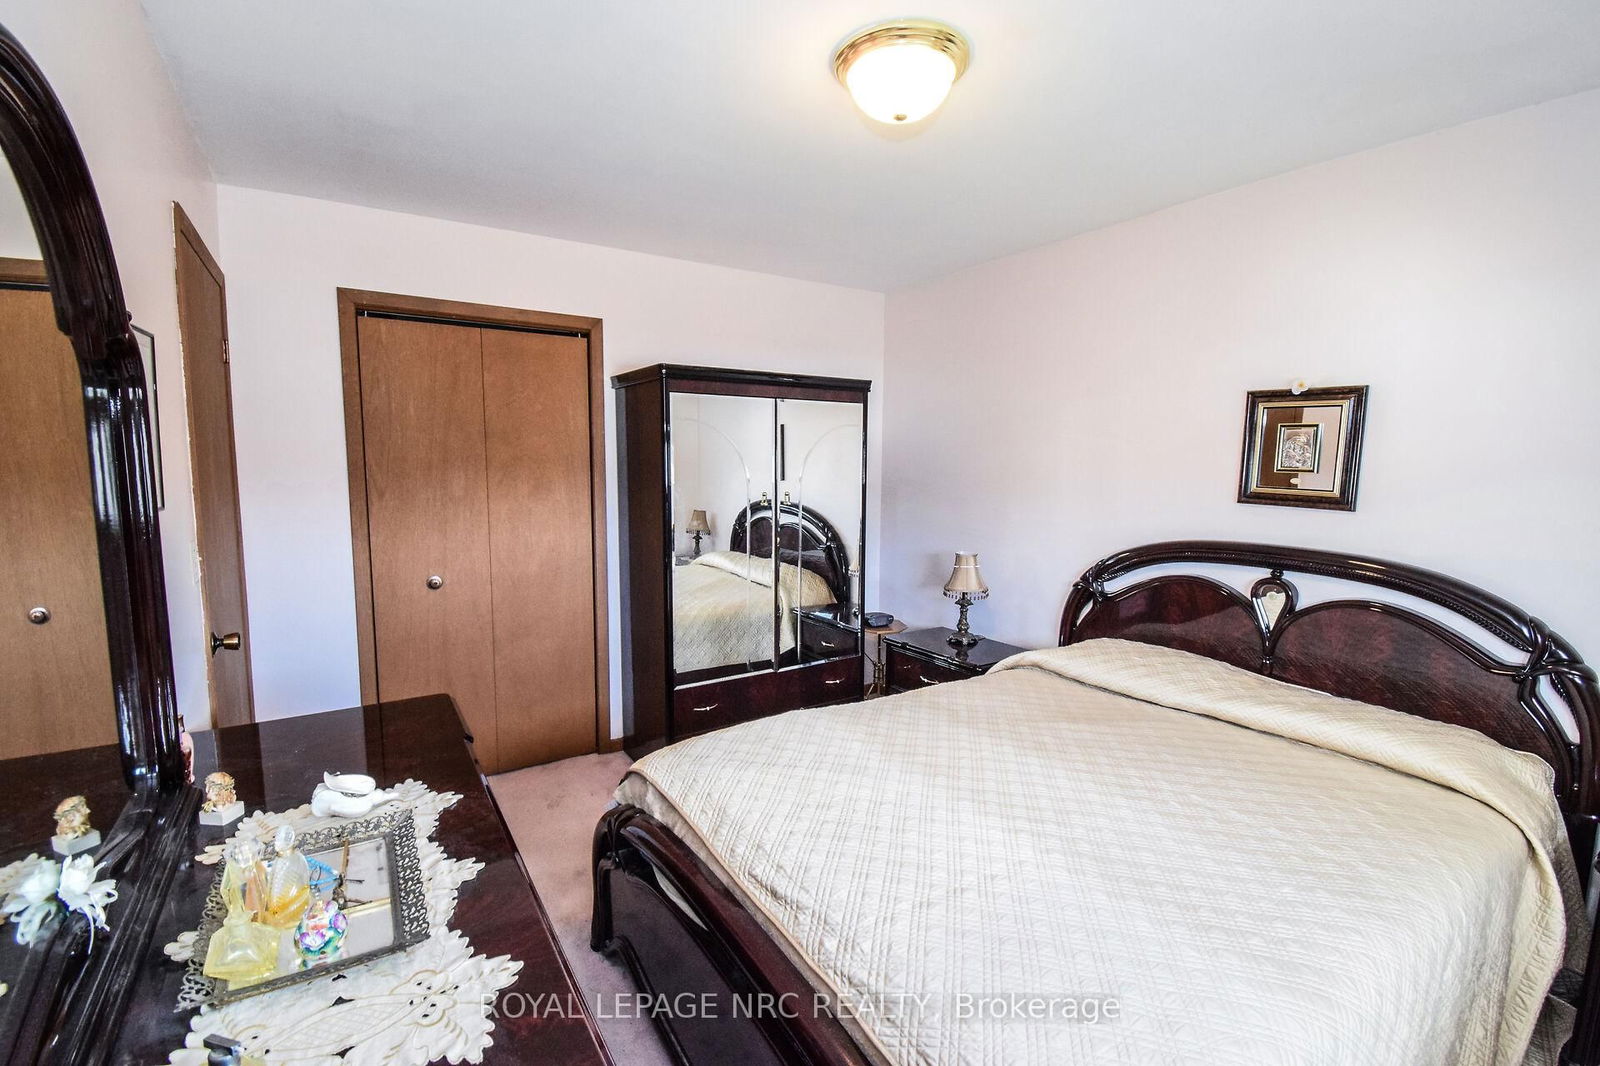
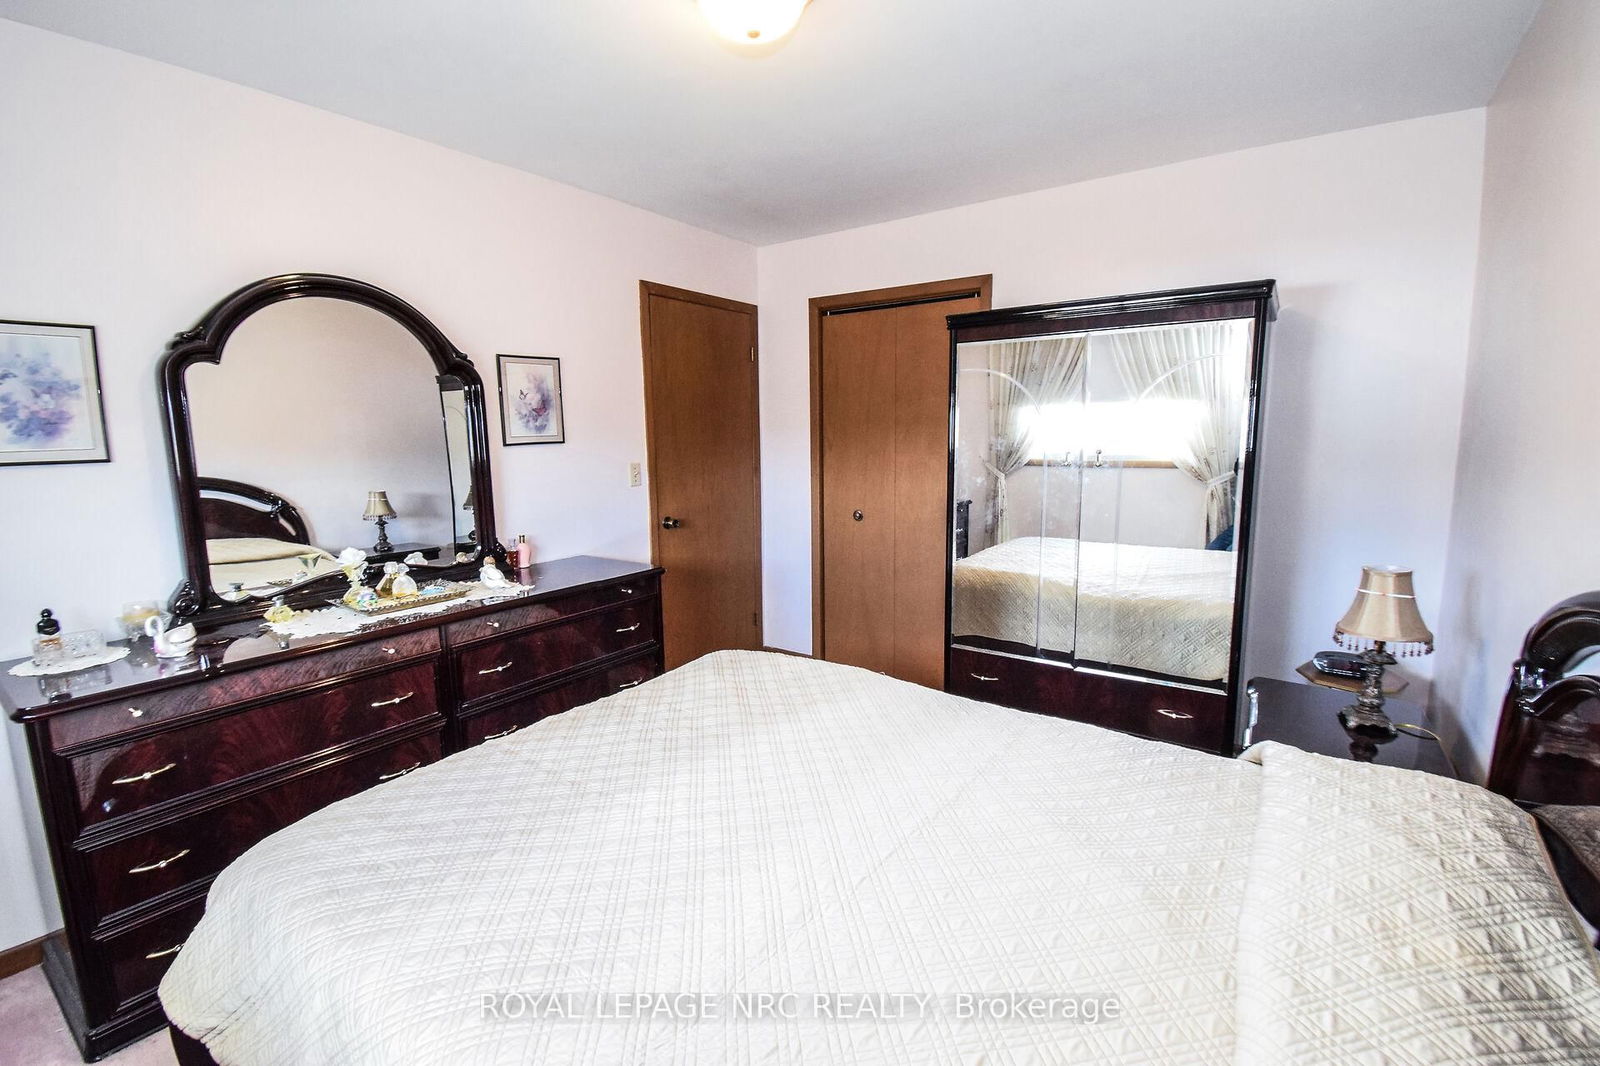
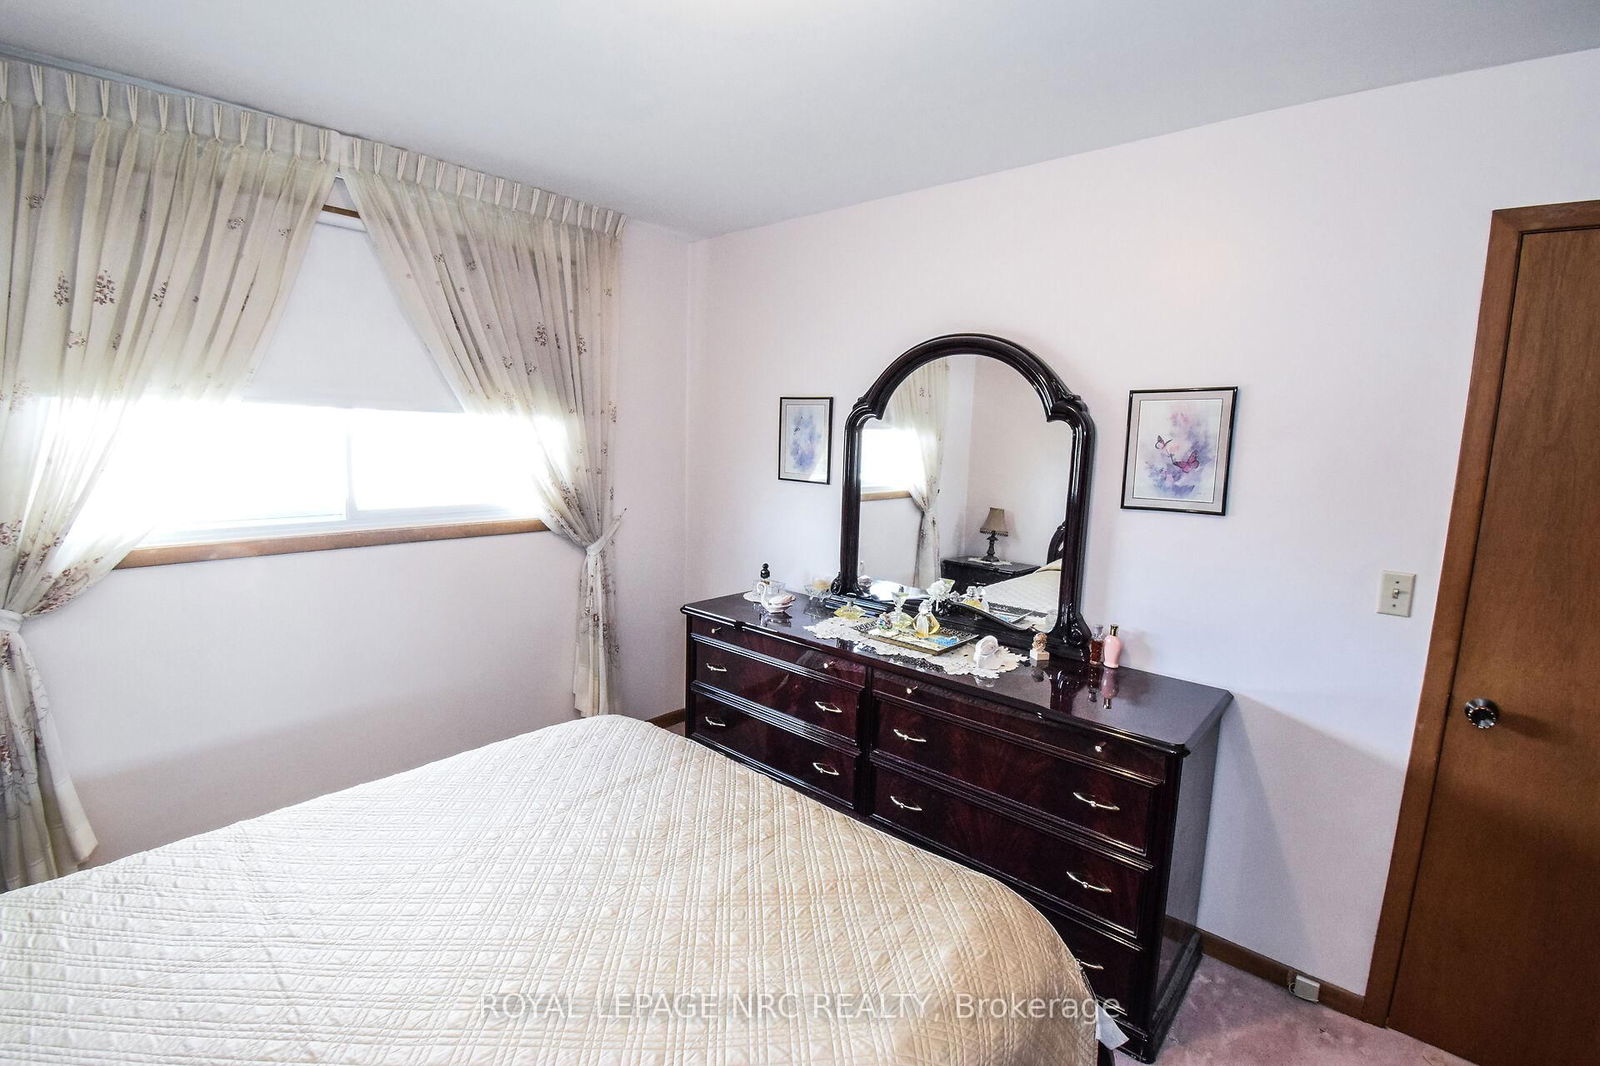
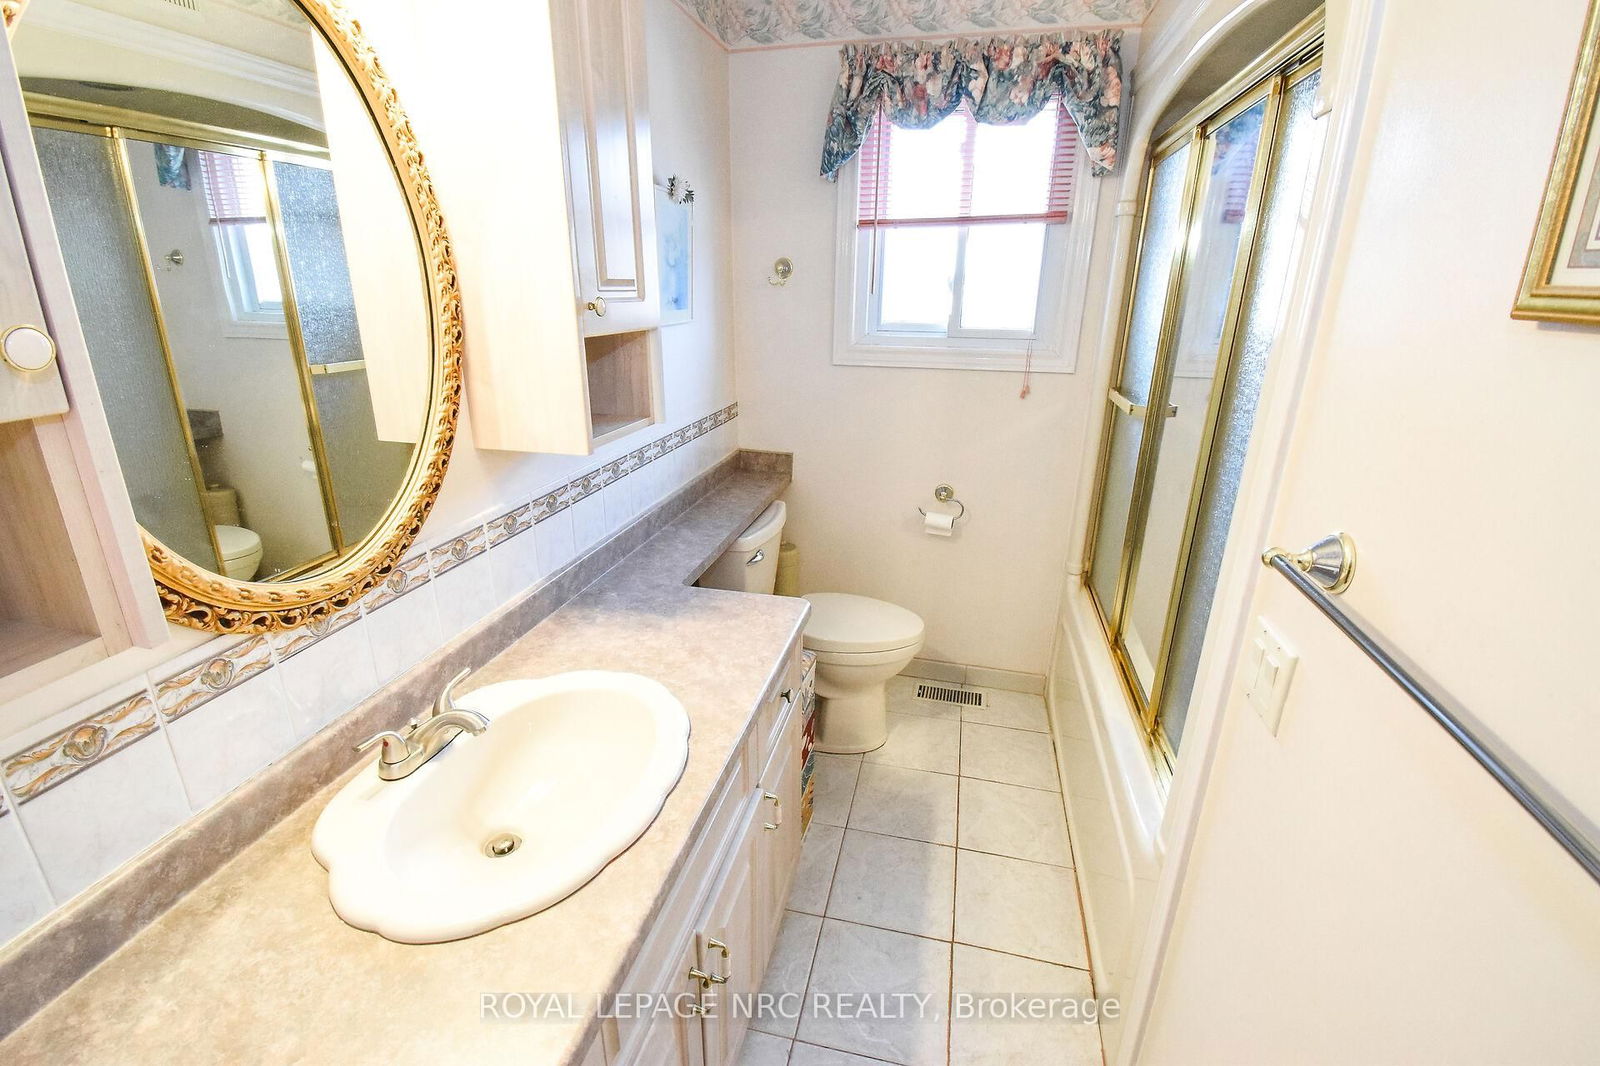
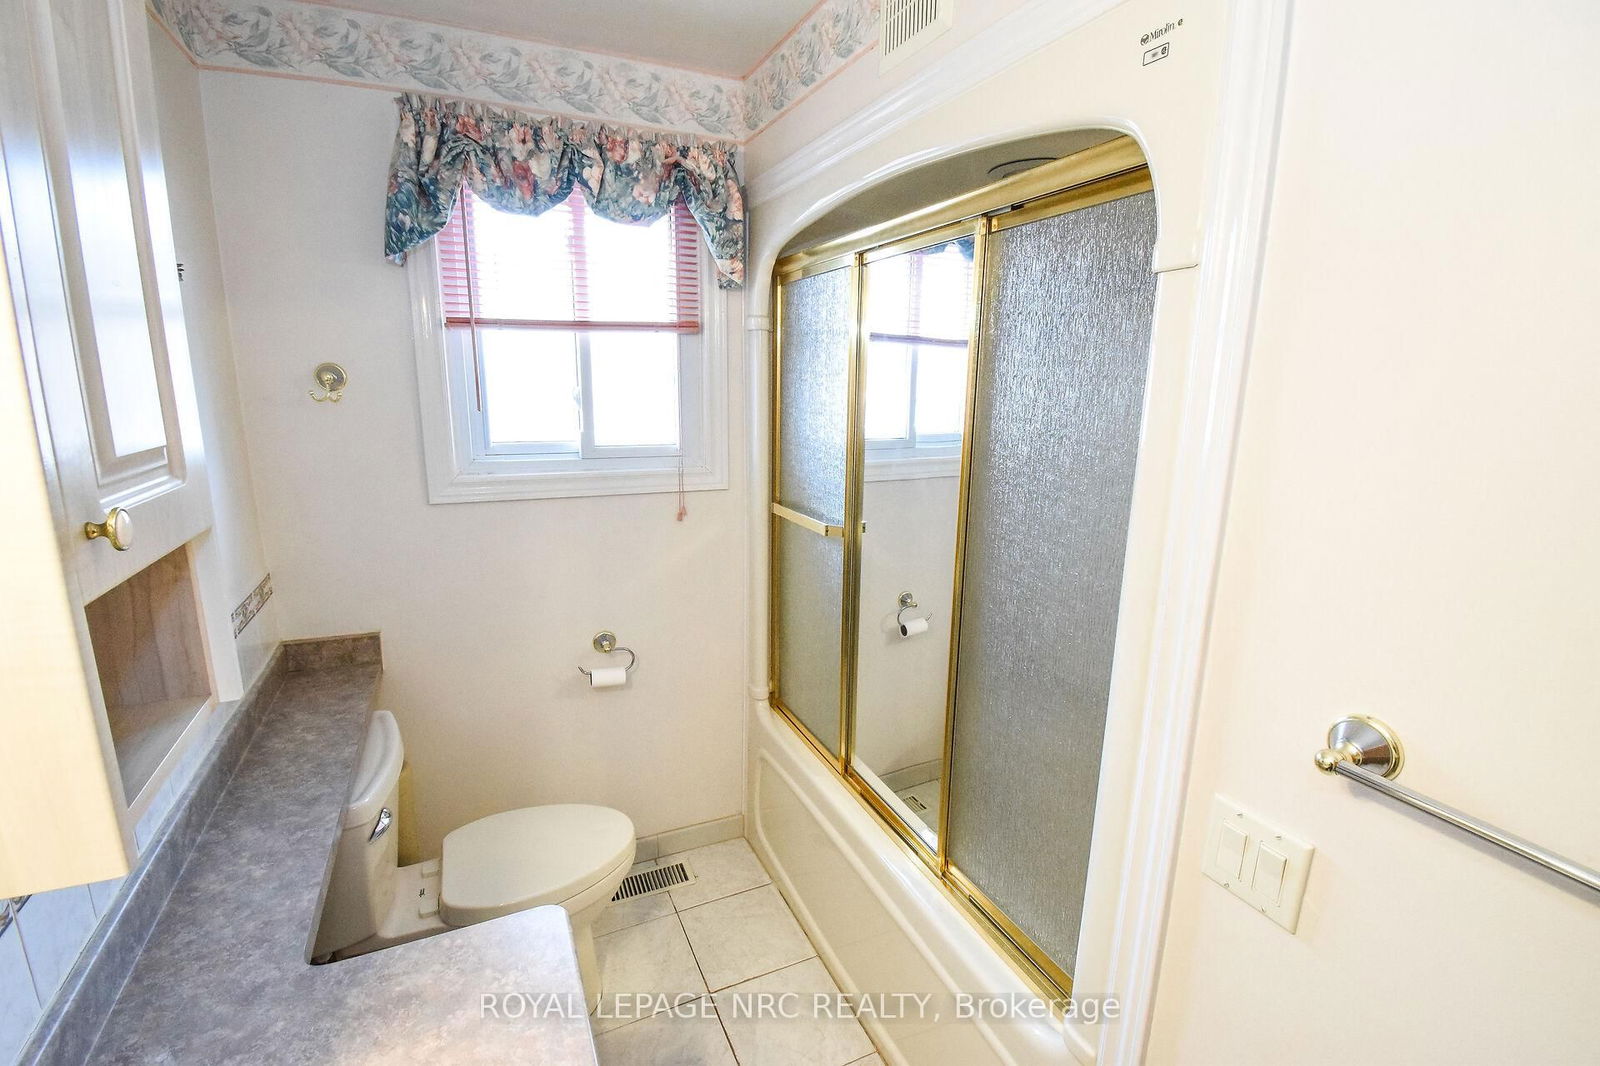
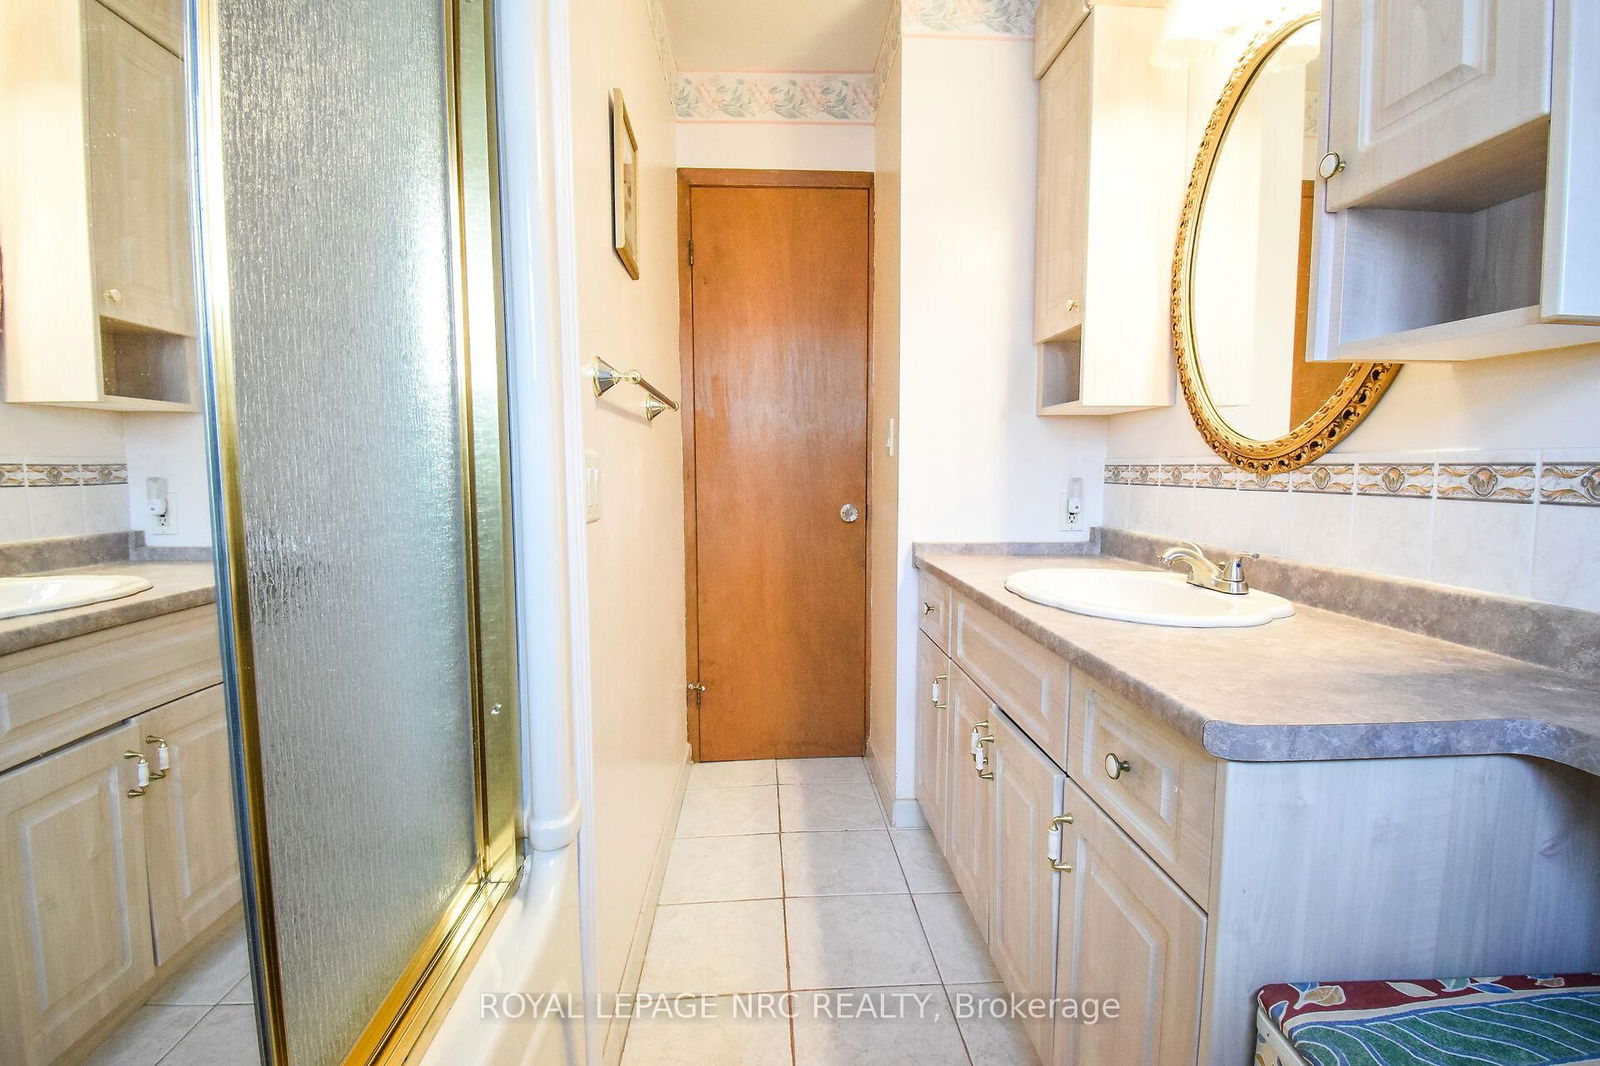
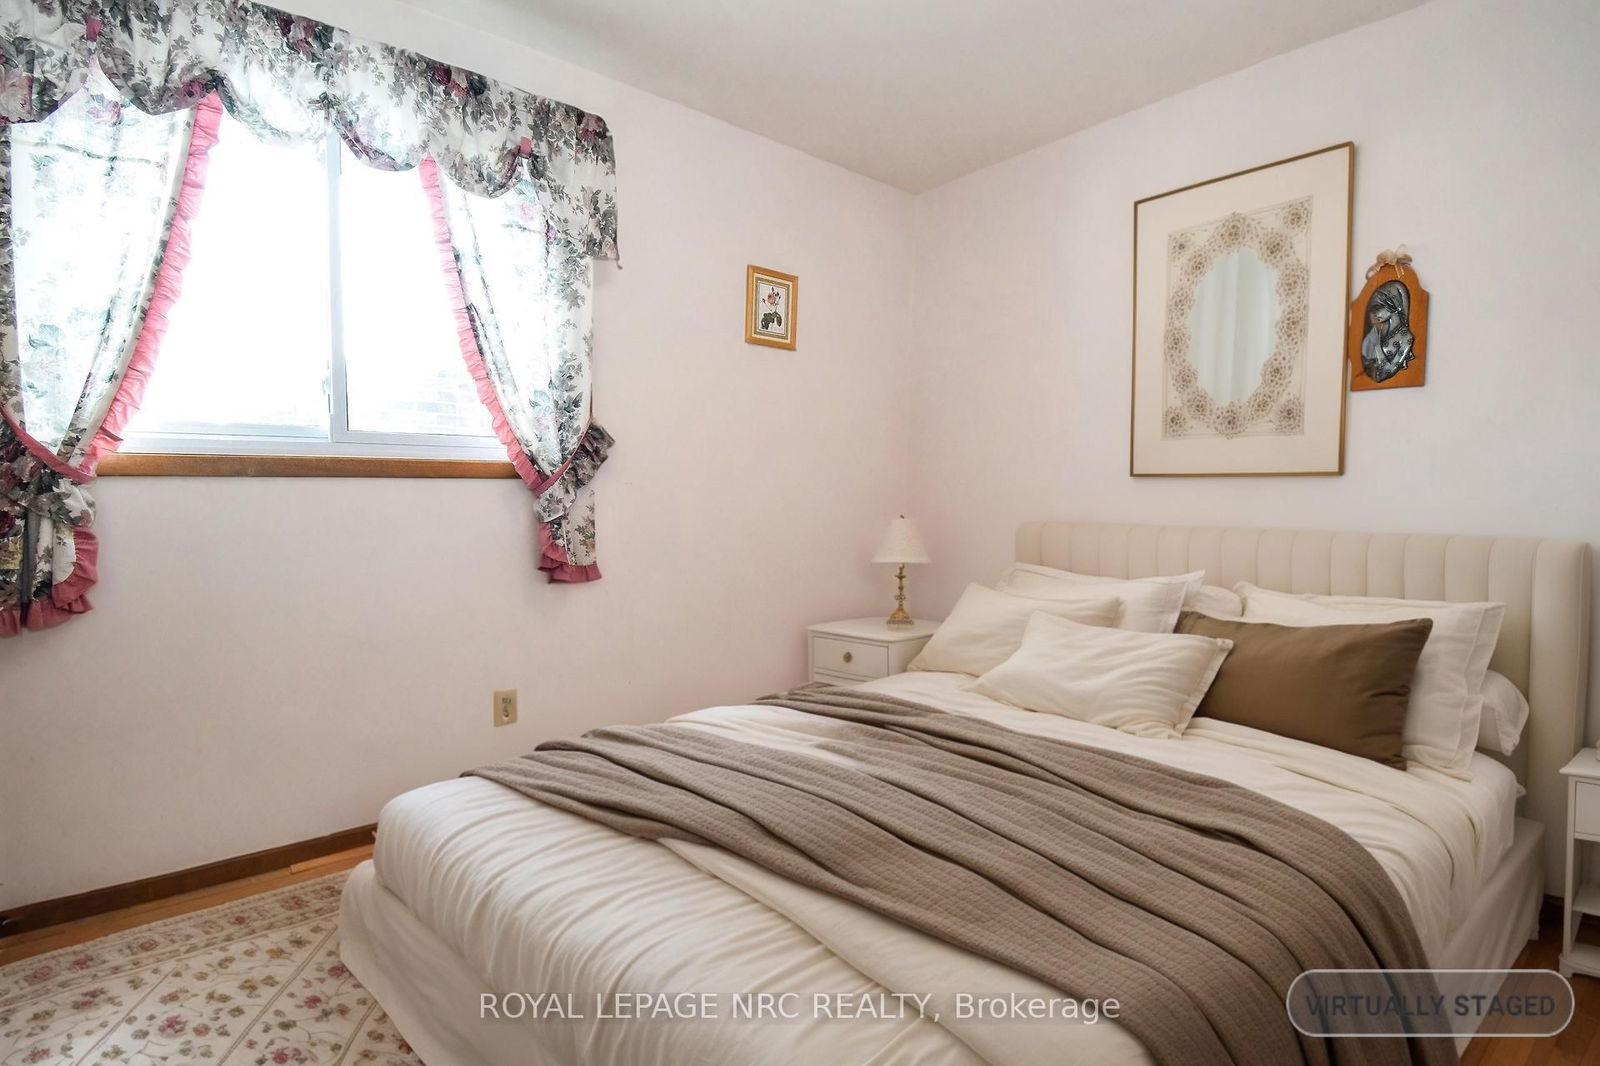
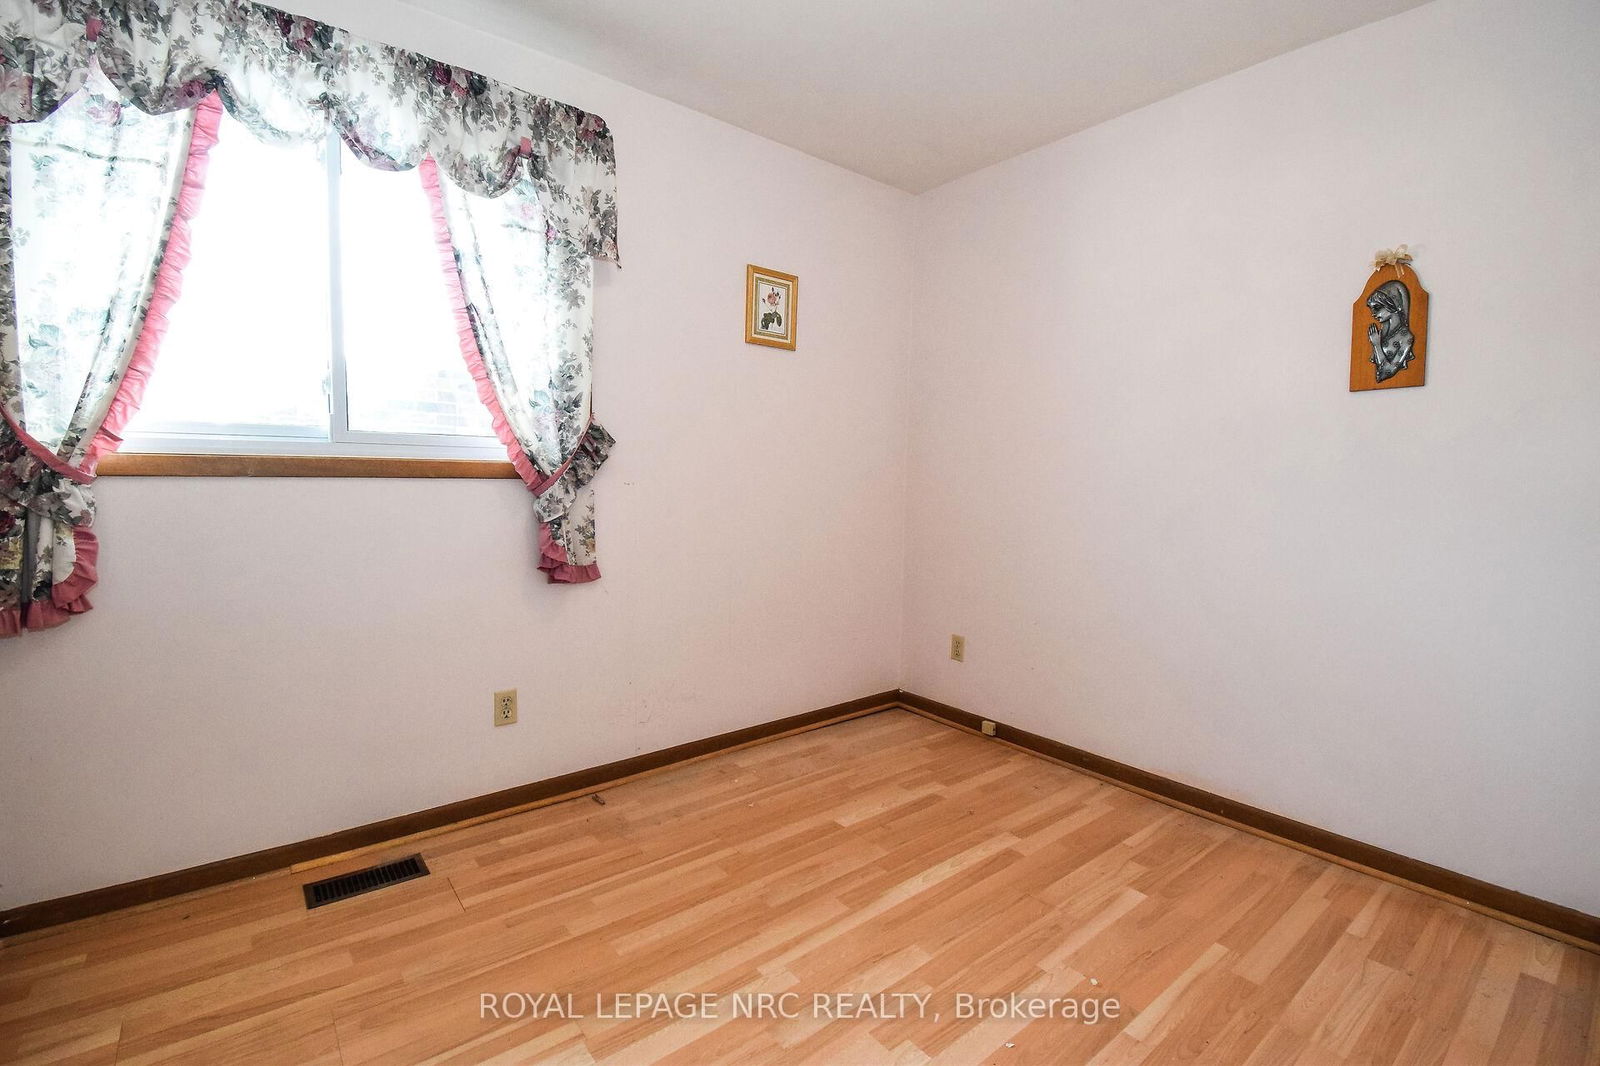
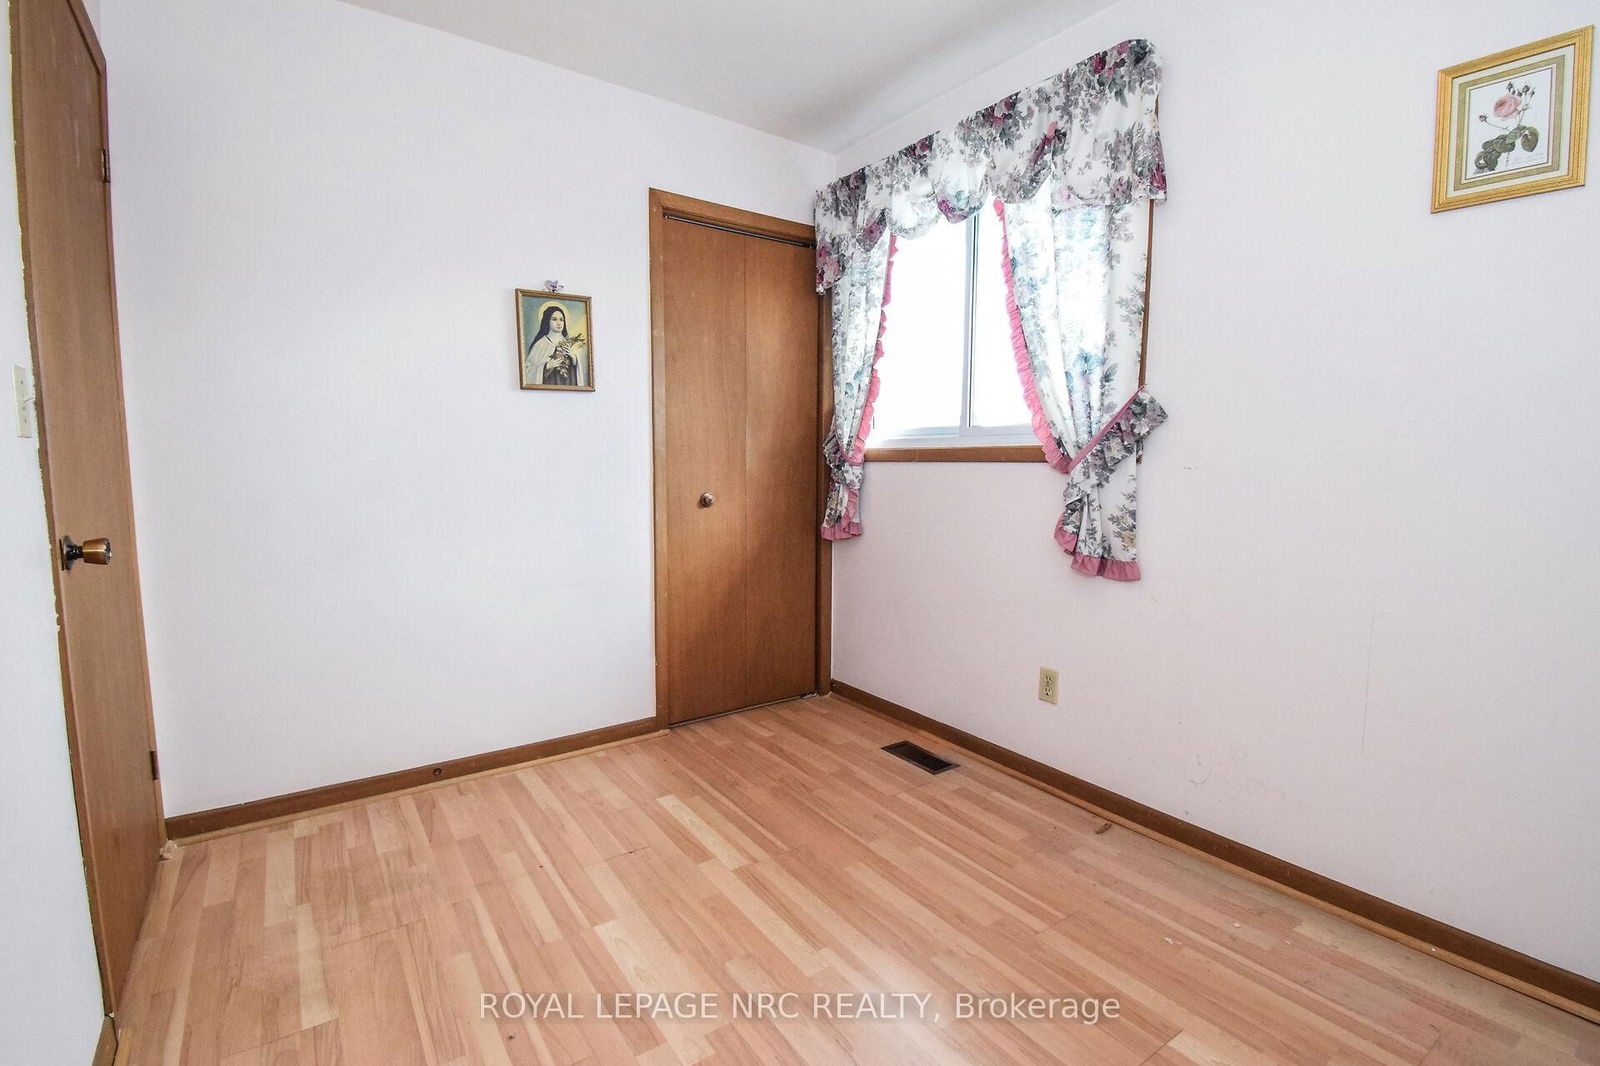
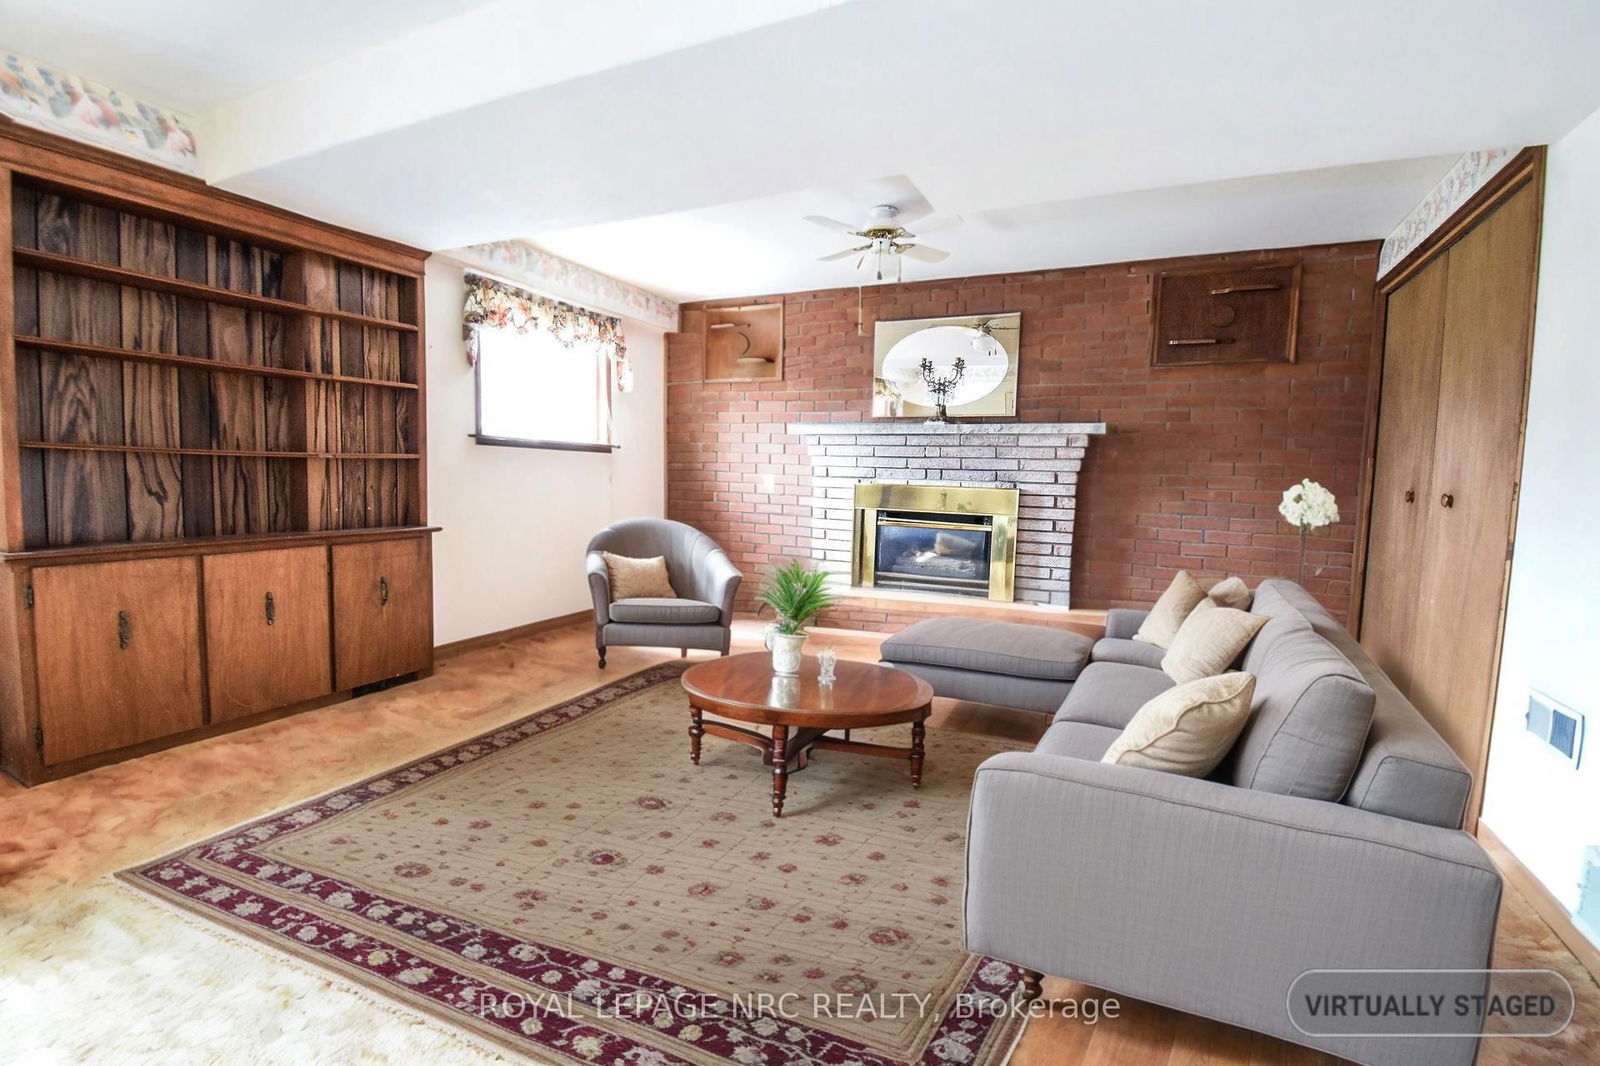
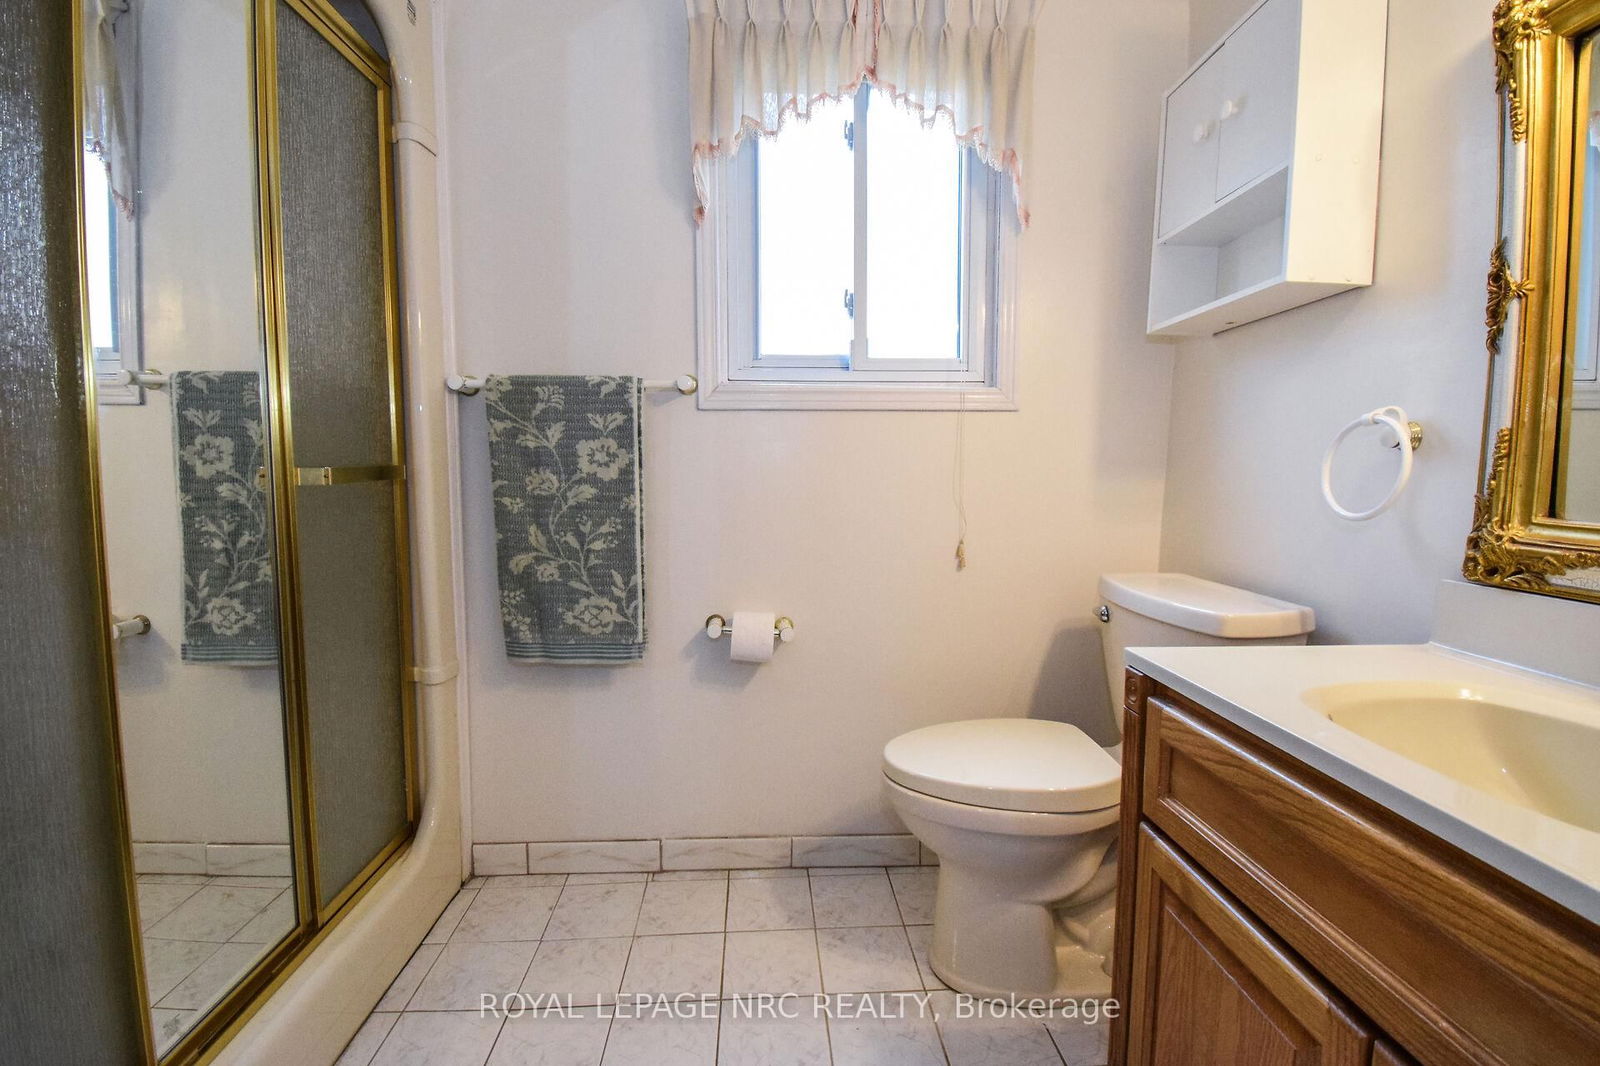
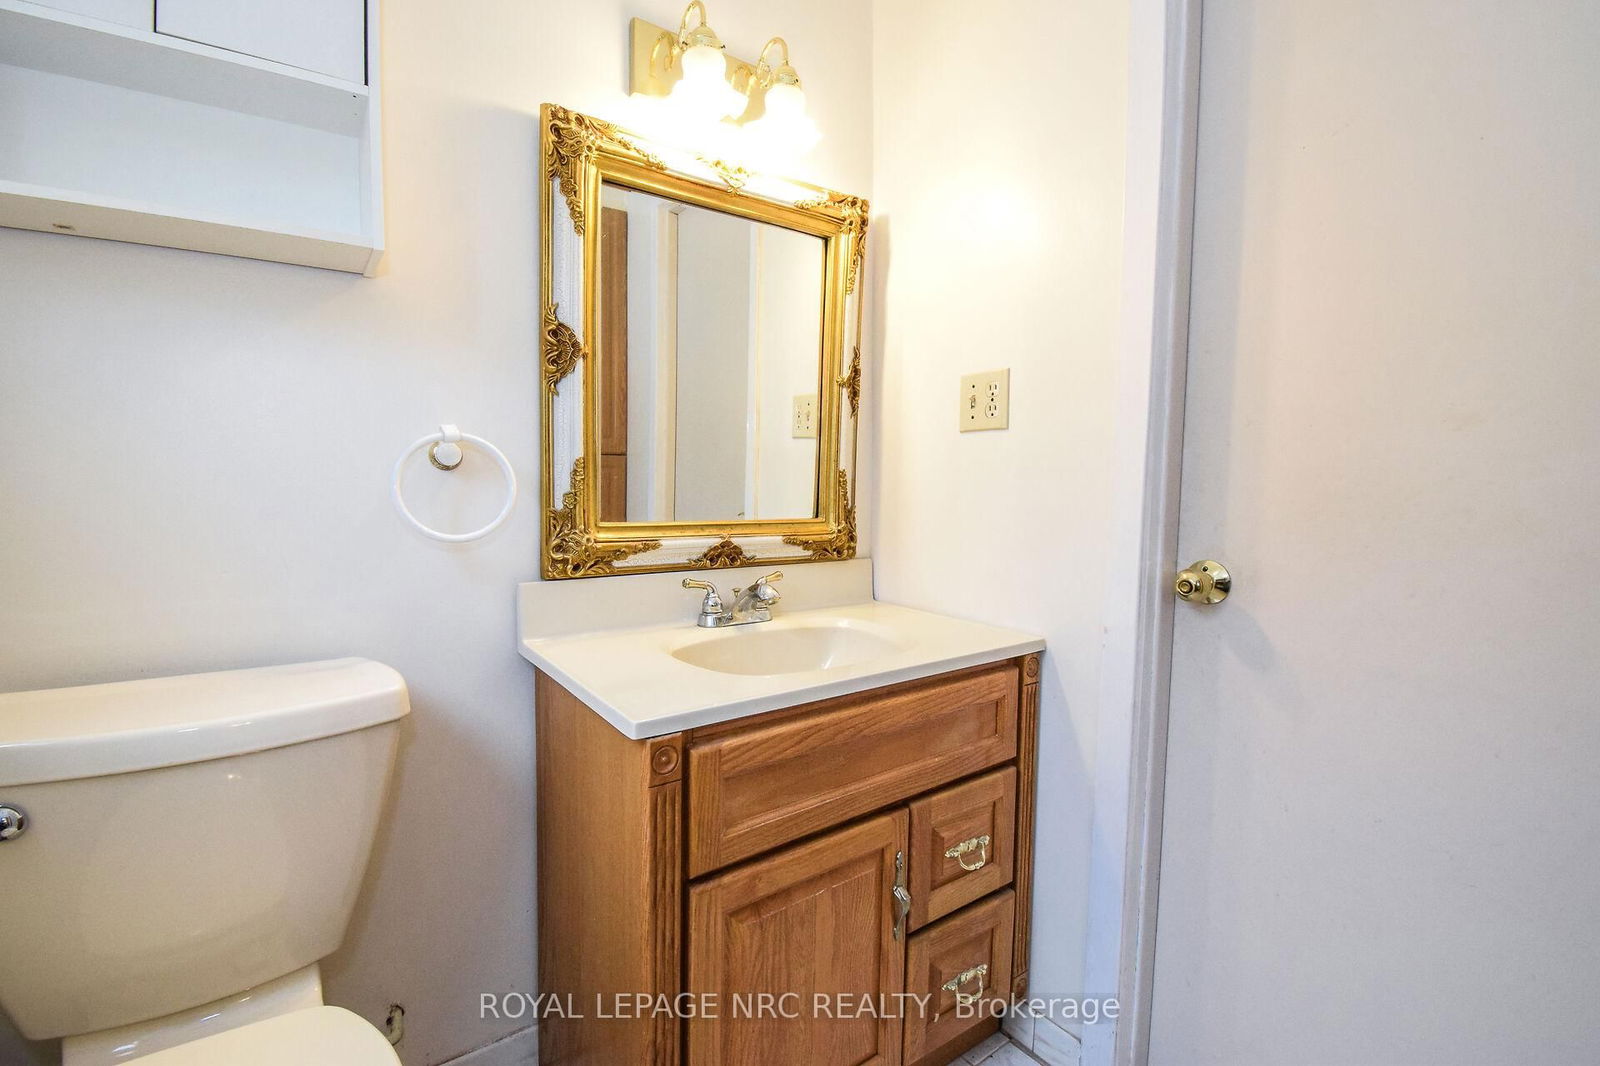
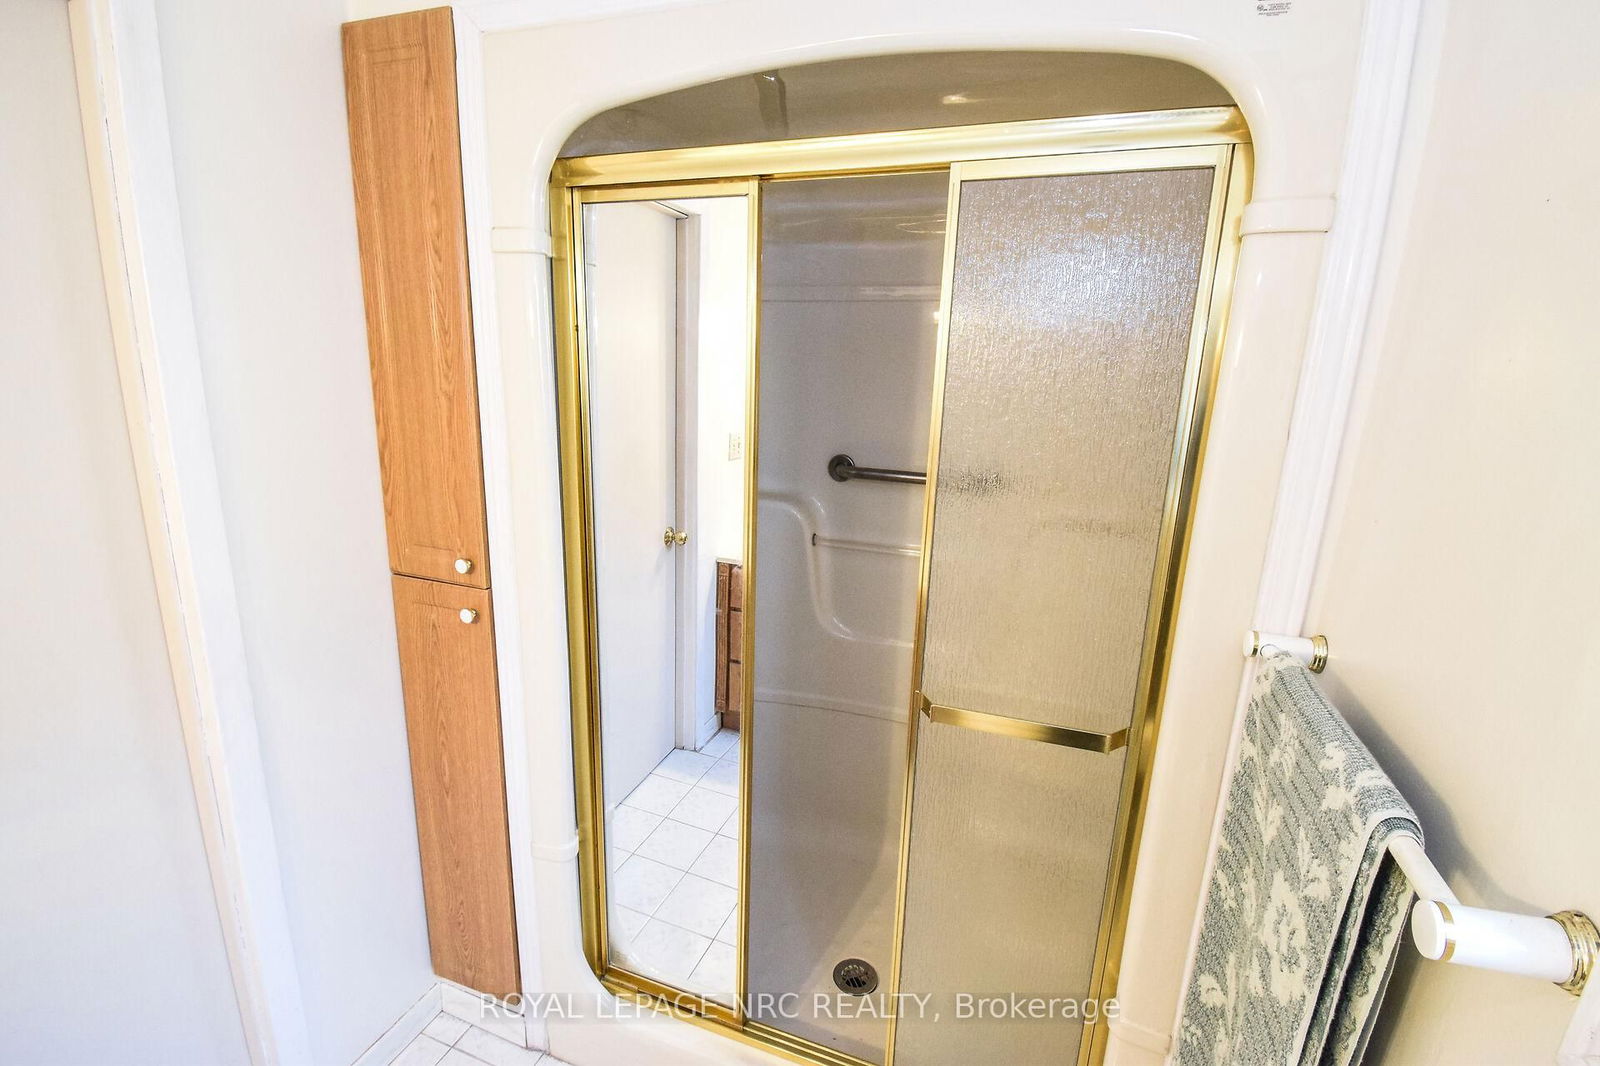
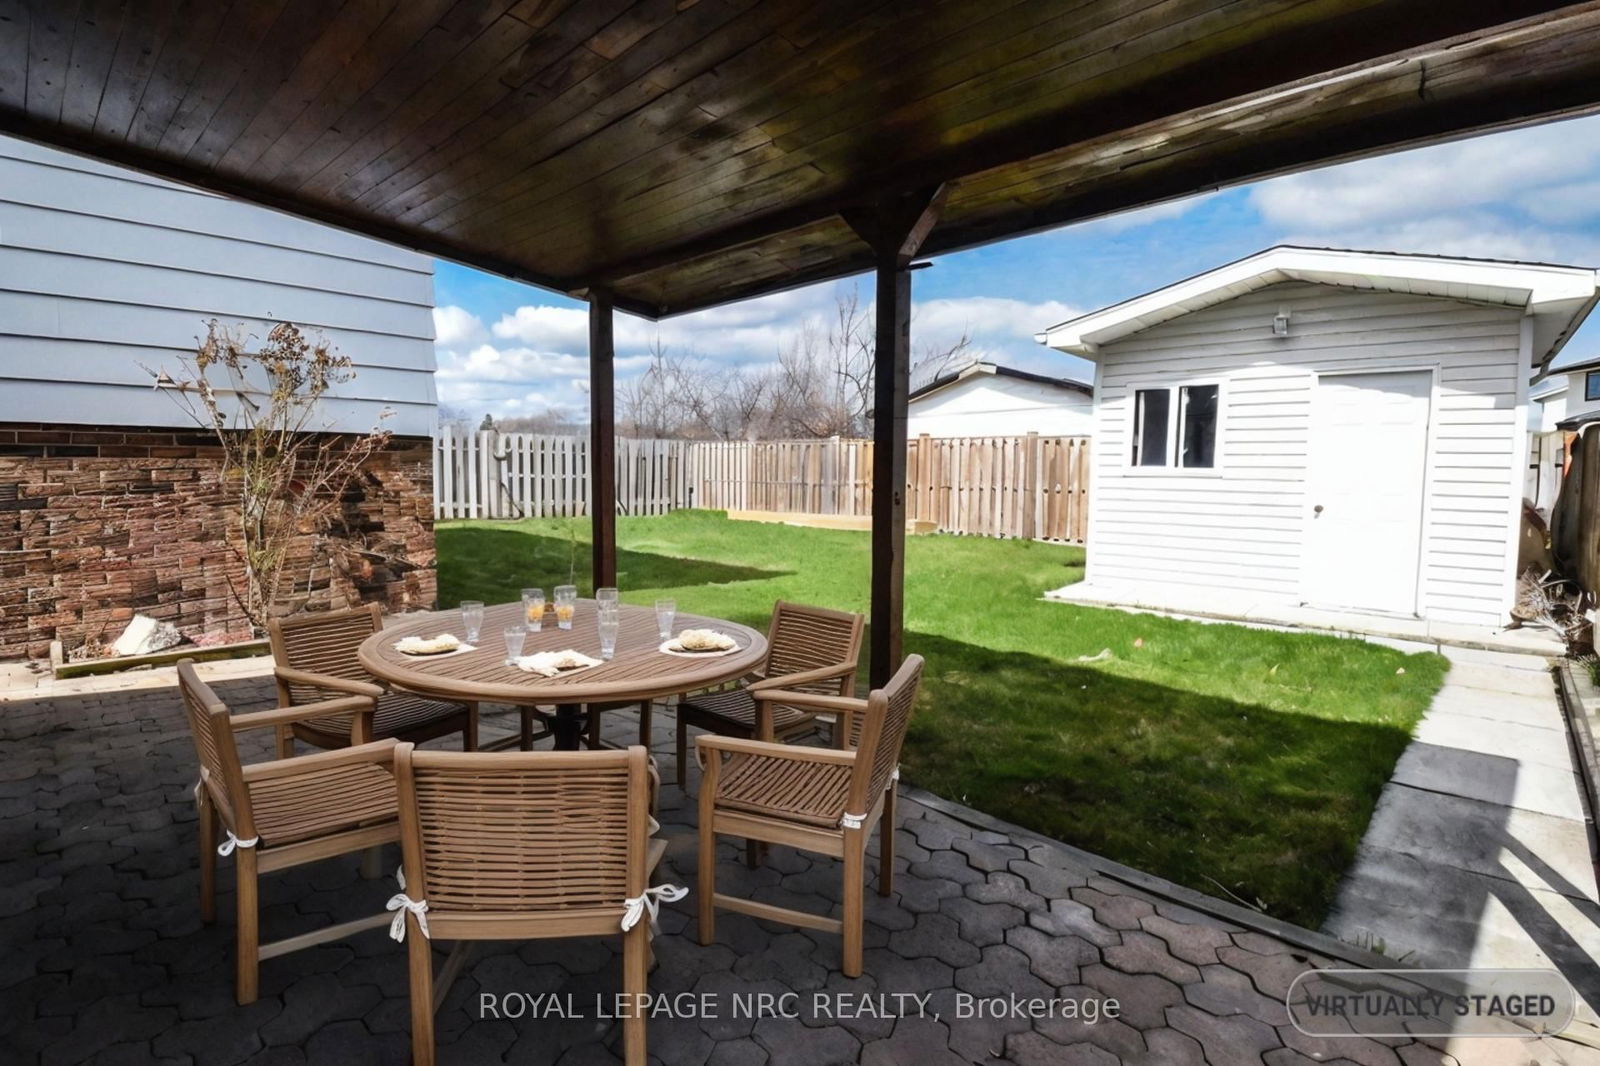
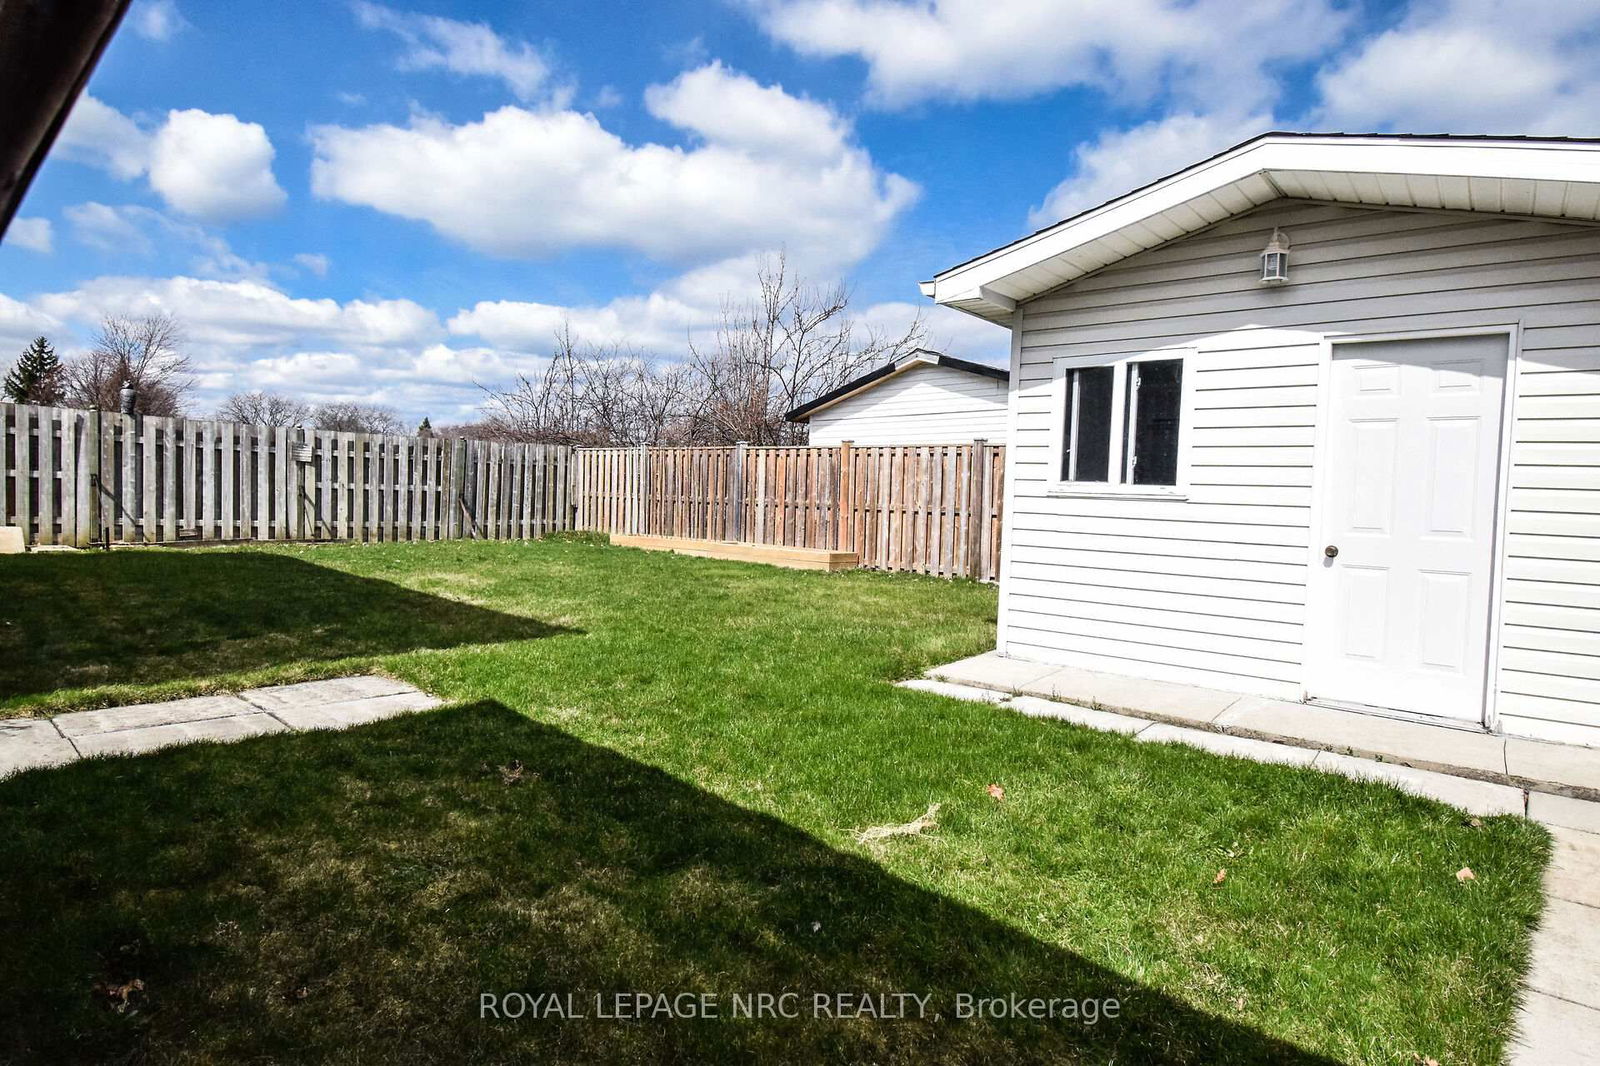
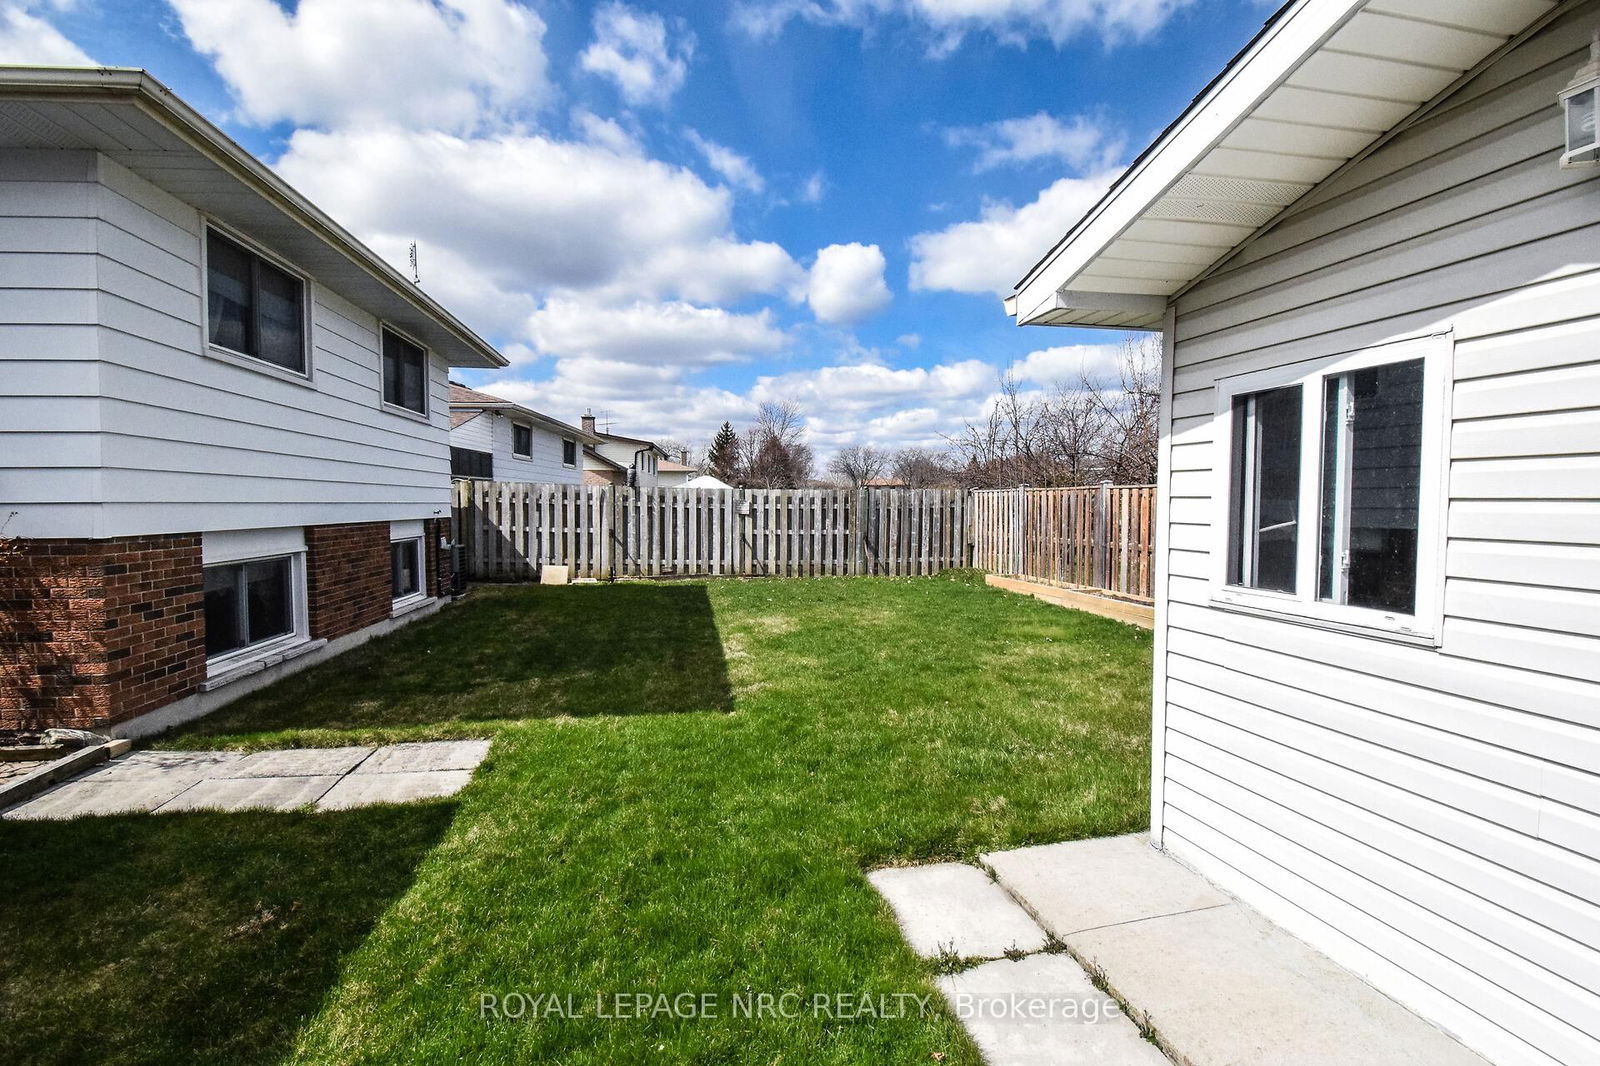
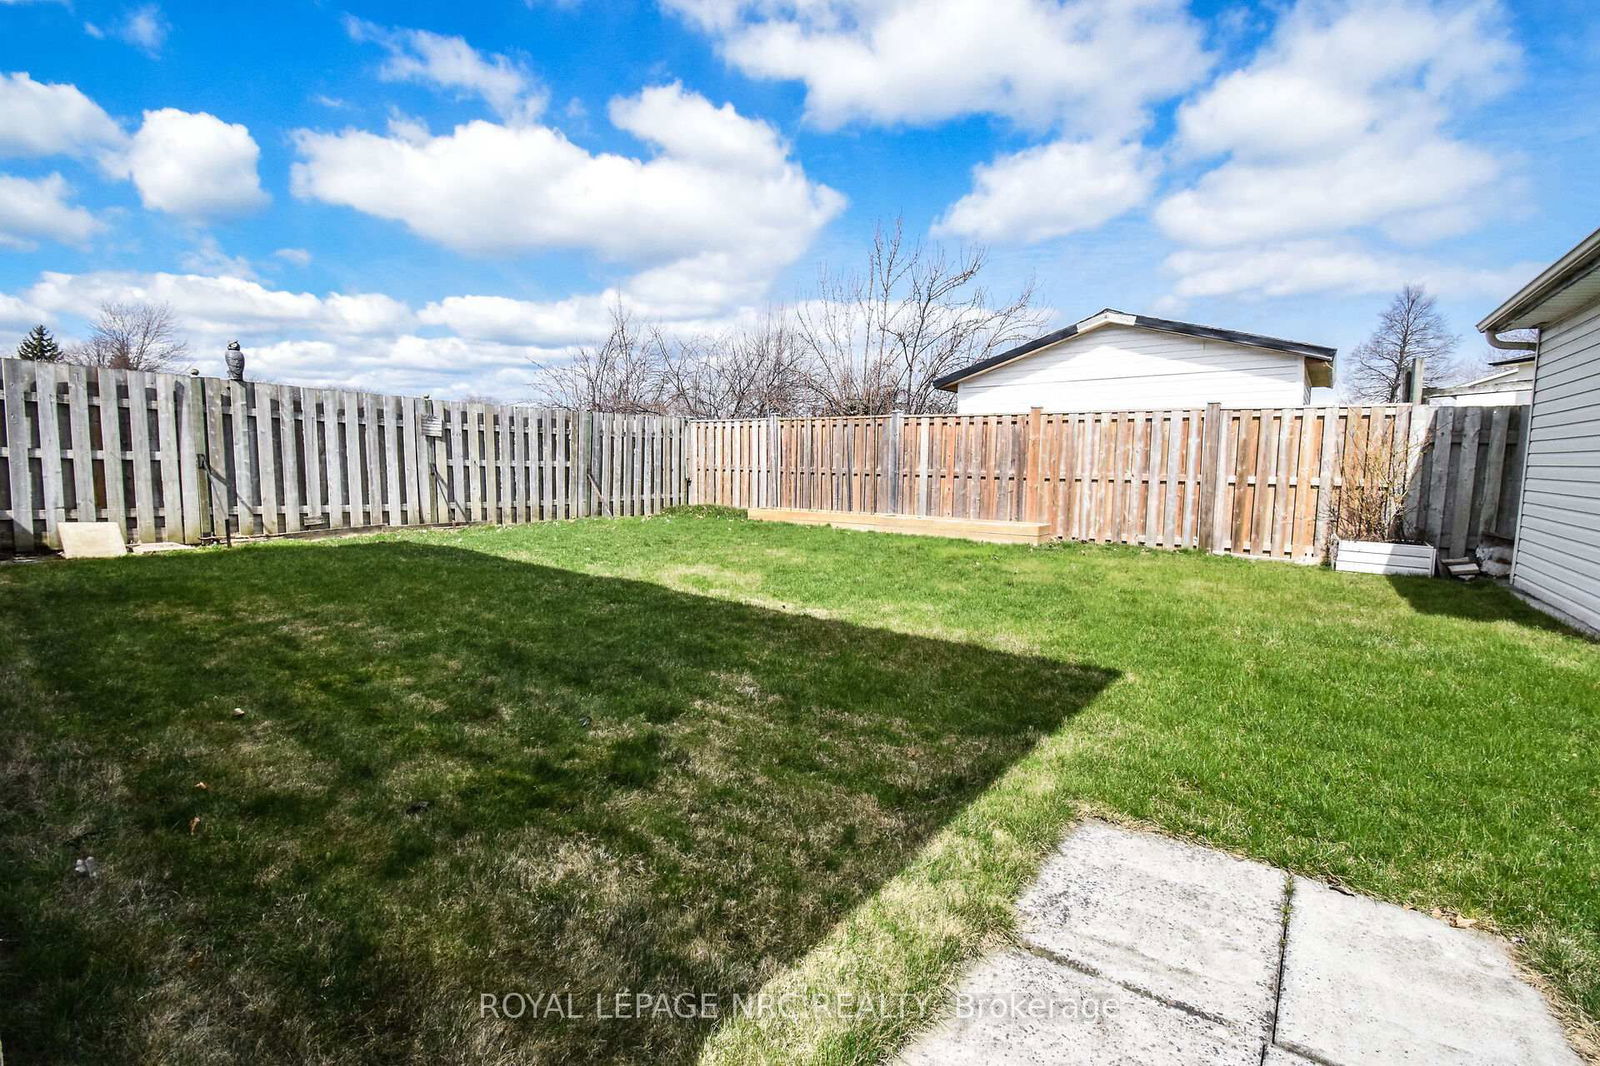
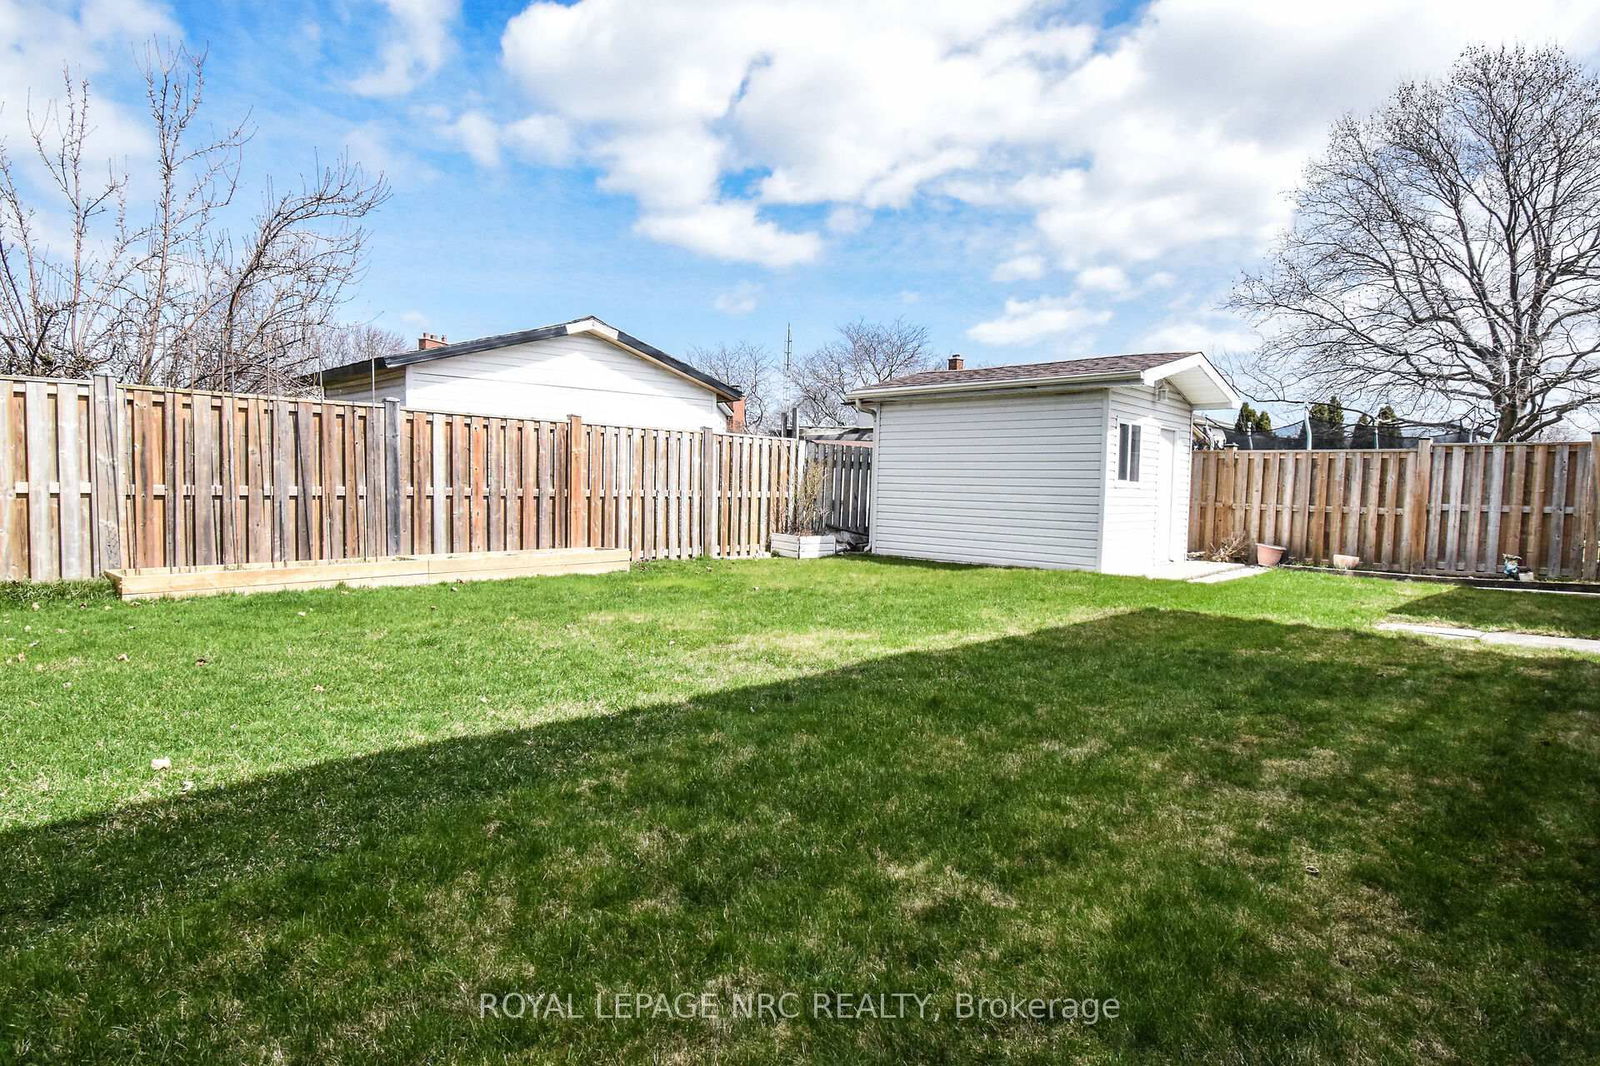
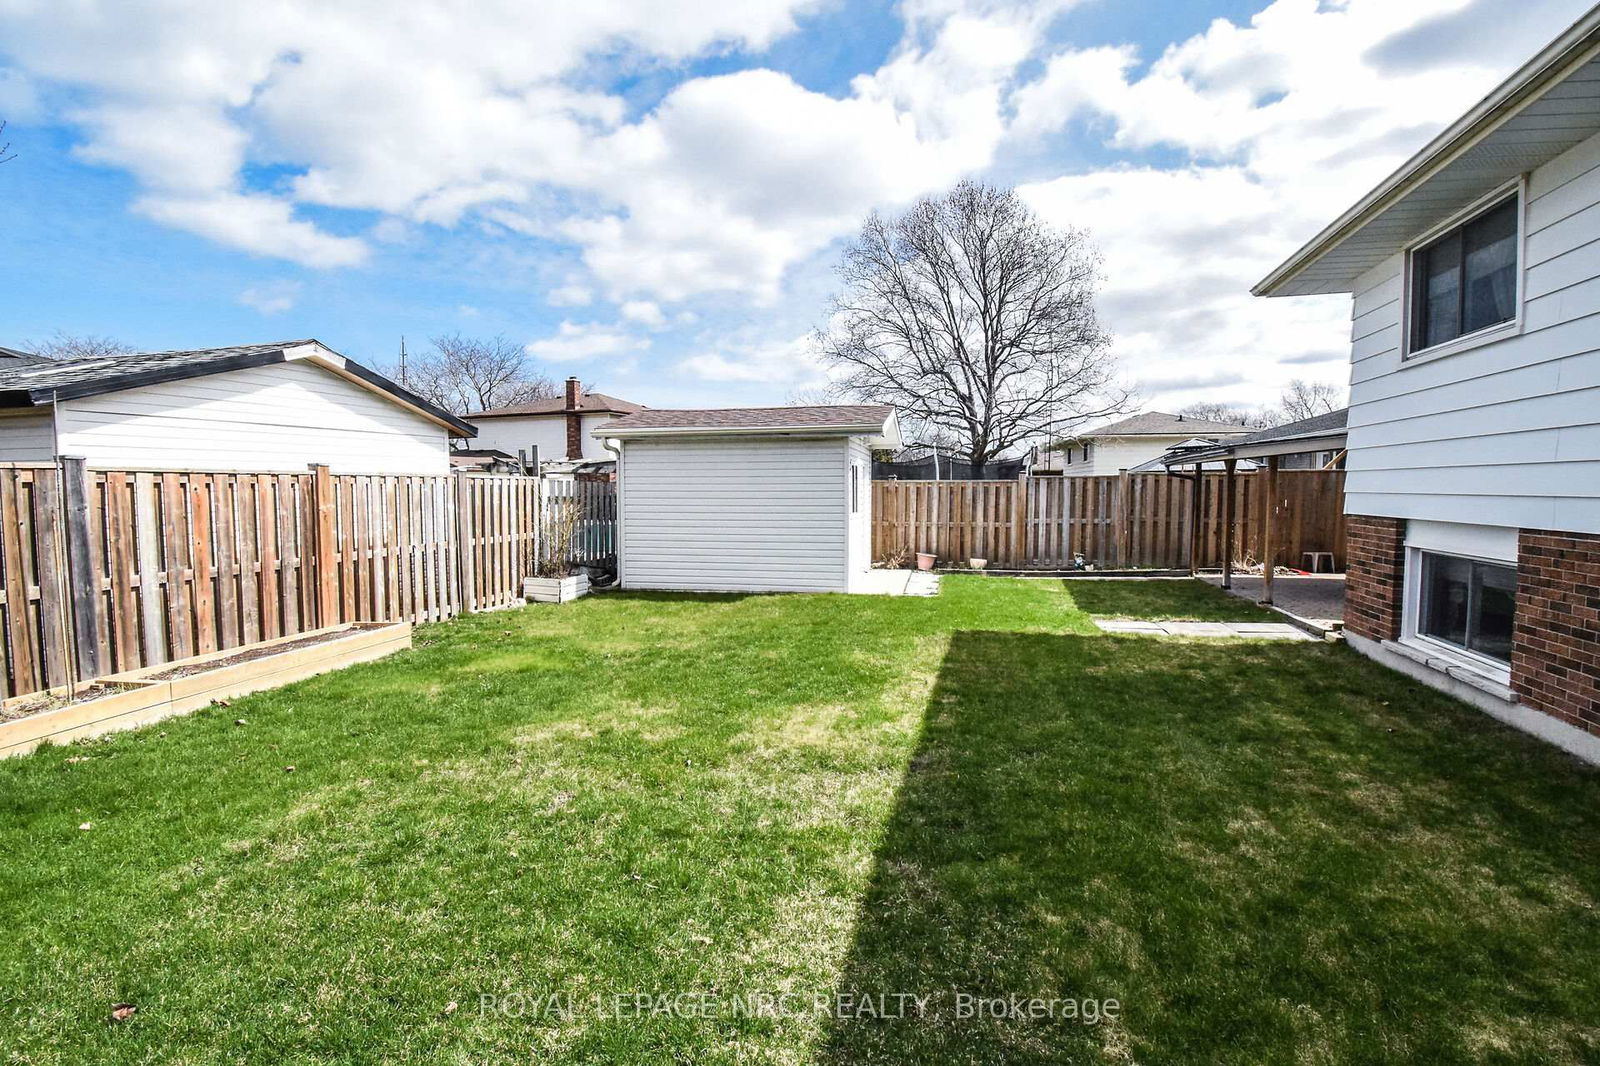
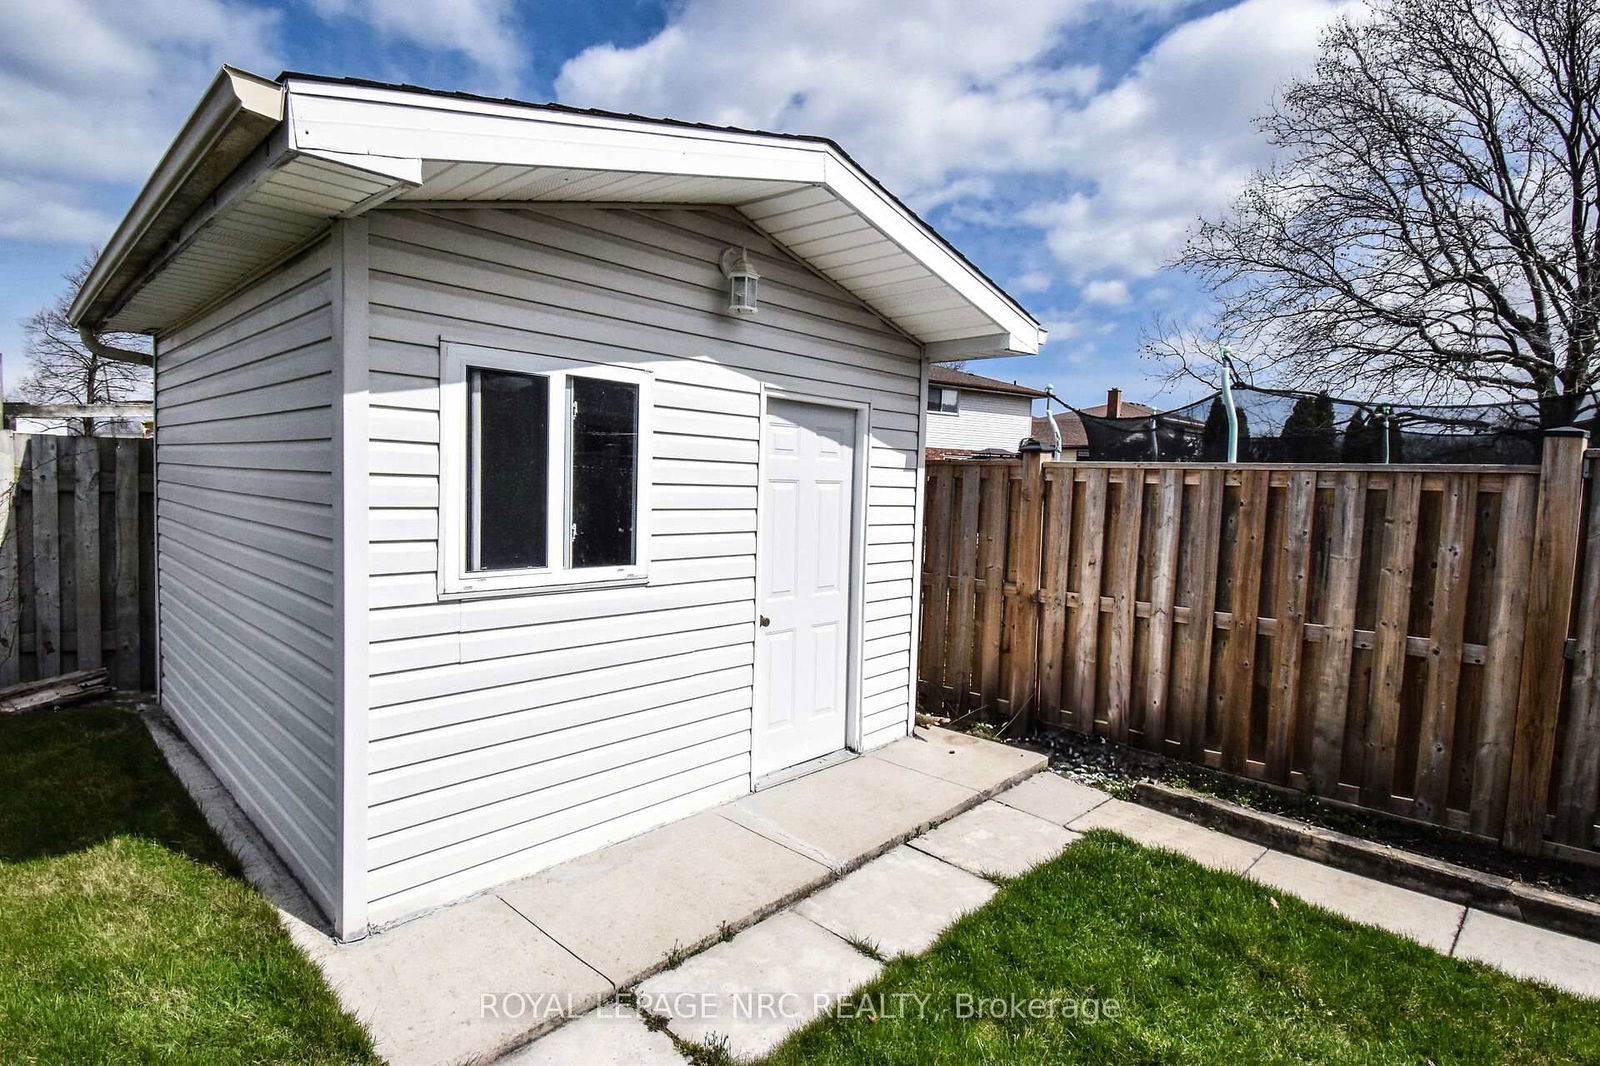
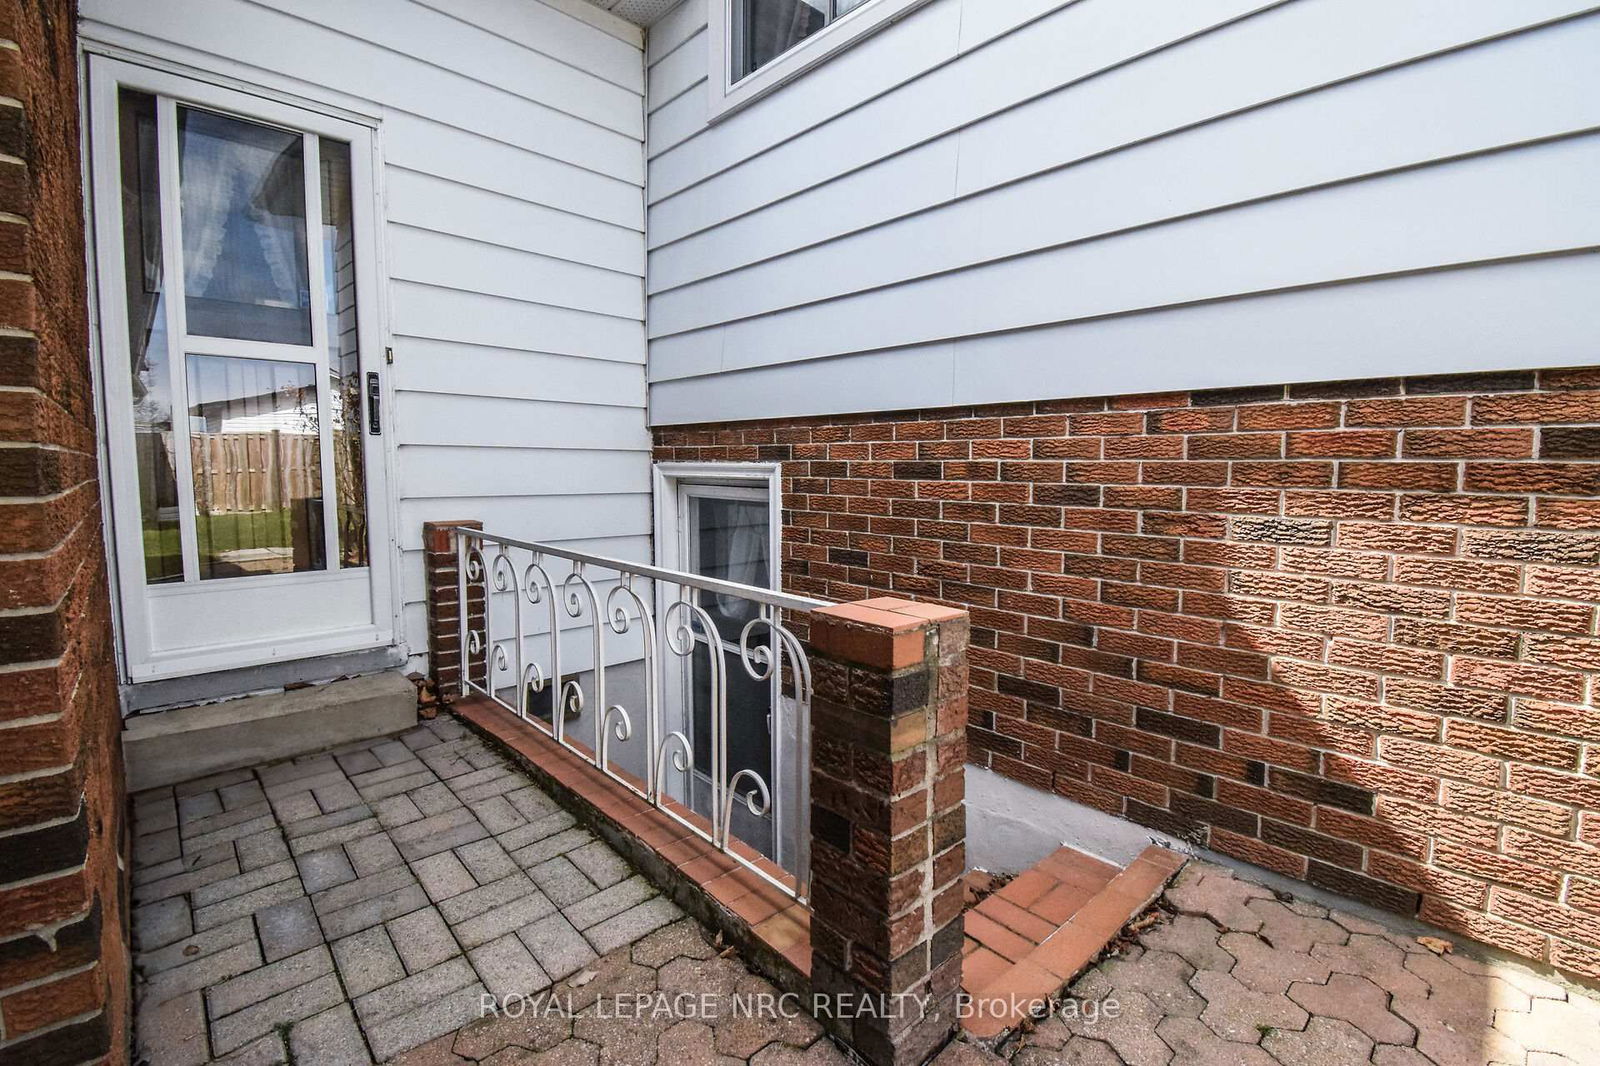
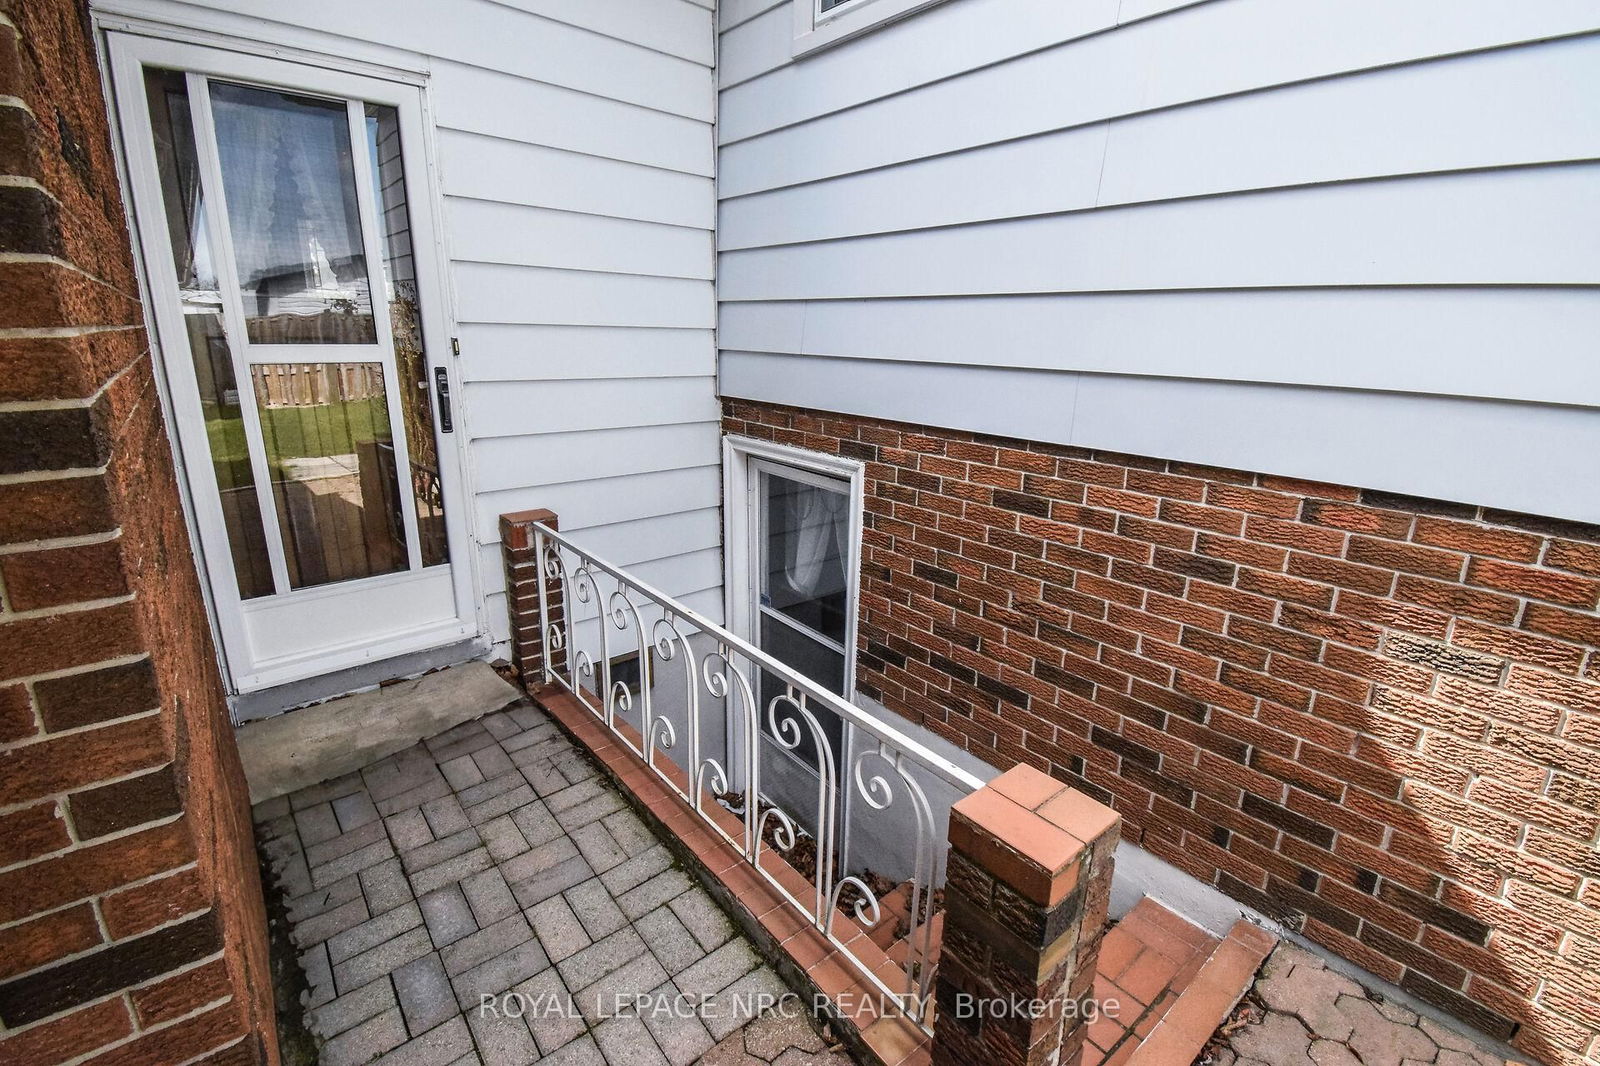
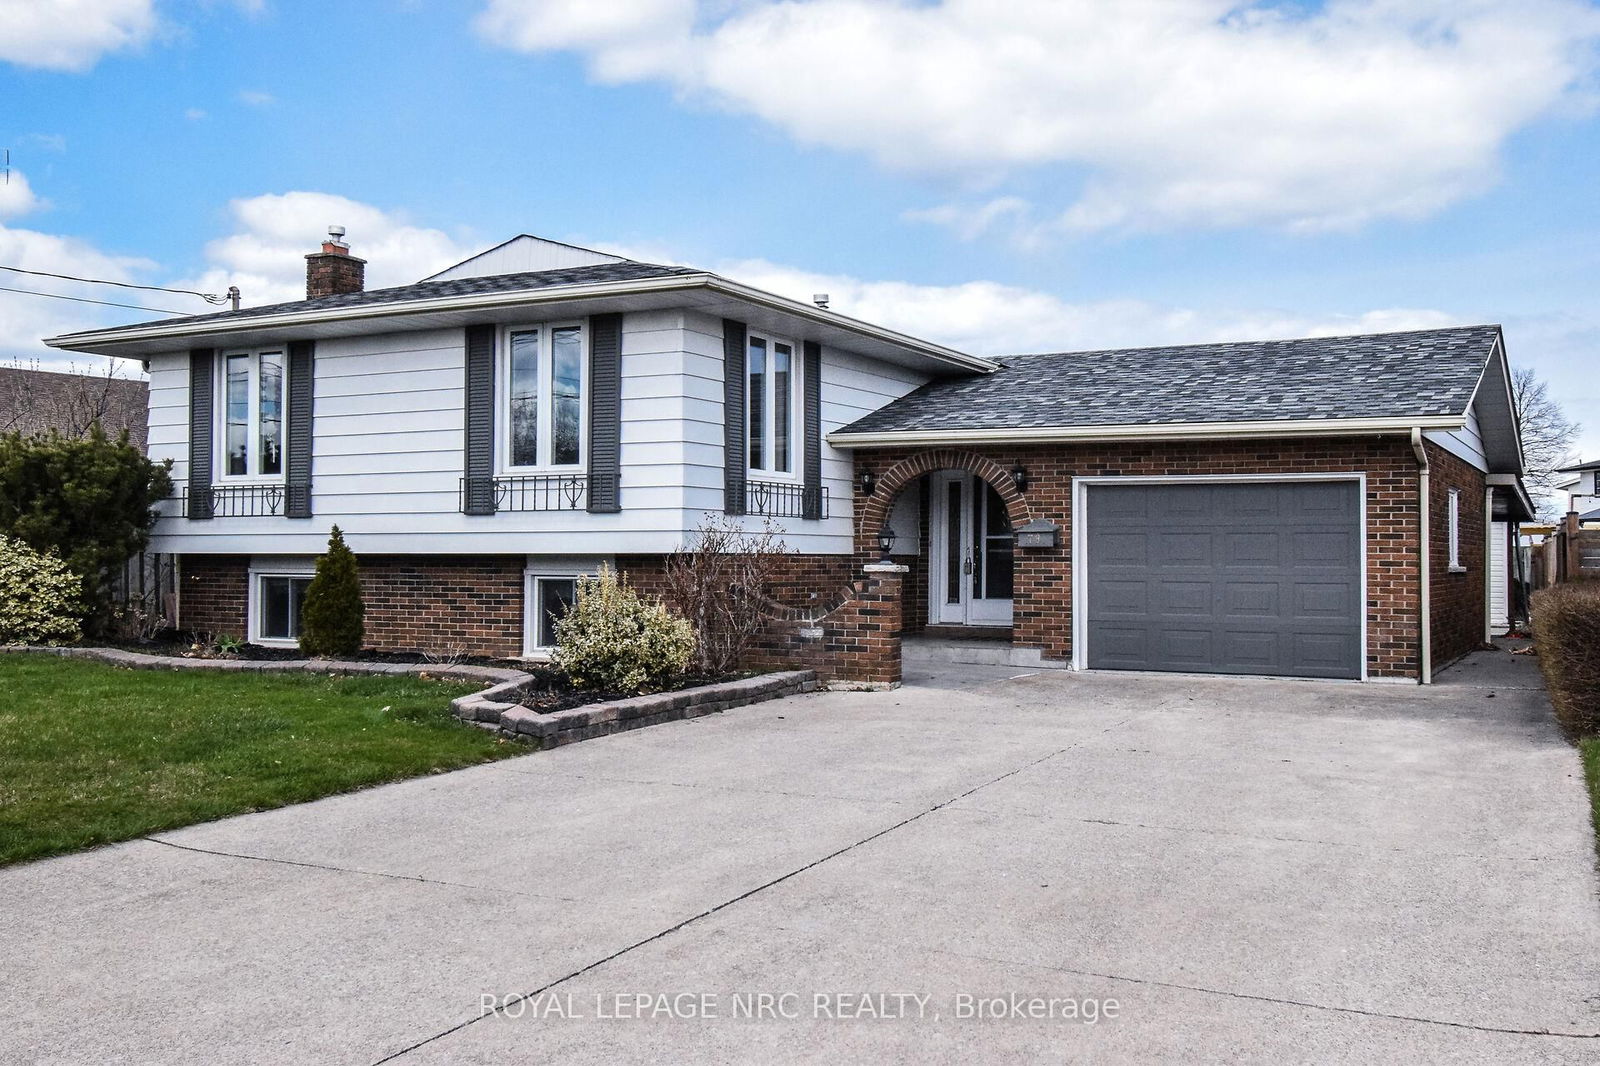
"LONGTIME FAMILY HOME & VERY WELL CARED FOR 3+1 BED, 2 FULL BATH, 2 FULL KITCHENS, RAISED BUNGALOW WITH ATTACHED GARAGE W/ INSIDE ACCESS, FINISHED LOWER LEVEL WITH LARGE FAMILY RM & GAS FIREPLACE & BASEMENT WALKOUT WITH POTENTIAL IN-LAW CAPABILITY, APPROX 2200 SQ FT OF LIVING AREA, AND FENCED PRIVATE BACK YARD WITH SHED & INTERLOCK COVERED PATIO, IN GREAT NORTHEND LOCATION, " Welcome to 79 Sherman Dr in St. Catharines, As you approach, you notice the large double wide concrete drive great for 4+ cars and attached garage with inside access. Enter into the home and you are greeted with large foyer entrance with inside access to garage on one side and stairs leading up and down stairs. Heading upstairs and you greeted with large L-Shaped living room & dining room combination with generous sized eat-in kitchen with plenty of counter & cabinet space. As you continue, you notice 3 generous sized bedrooms with plenty of closet space and a 4 pc main bath. Downstairs you have beautiful family rm with gas-fireplace, generous sized 2nd kitchen & laundry area and another possible bedroom(currently a 2nd dining rm) & 3pc bath (easily set up in-law on the lower level) with walk-up to the back yard. Outside enjoy the private fenced yard with nice interlock covered patio. Close to schools, park, public transit, amenities and only minutes Come view this home and appreciate the care and love this family home has to offer
2 SHEDS, WINDOW COVERINGS, ALL ELECTRIC LIGHT FIXTURES, GARAGE DOOR OPENER, FRIDGE, STOVE,WASHER & DRYER, (ALL APPLS IN AS IS CONDITION)
Foyer
Living
Dining
Kitchen
Primary
2nd Br
3rd Br
Family
Kitchen
4th Br
Laundry
Bathroom
Bathroom
The graph below compares the average list price and average sale price of homes in this neighborhood by month for the last 24 months. When average sale price is greater than average list price, this may suggest a buyer's market. When average sale price is lower than the average list price this may suggest a seller's market.
The graph below illustrates the average days on market for homes in this neighborhood. The yellow area may indicate a buyer's market, the green area may indicate a balanced market and the red area may indicate a seller's market.
Sales Representative, Century 21 People’s Choice Realty Inc., Brokerage
(647) 576 - 2100
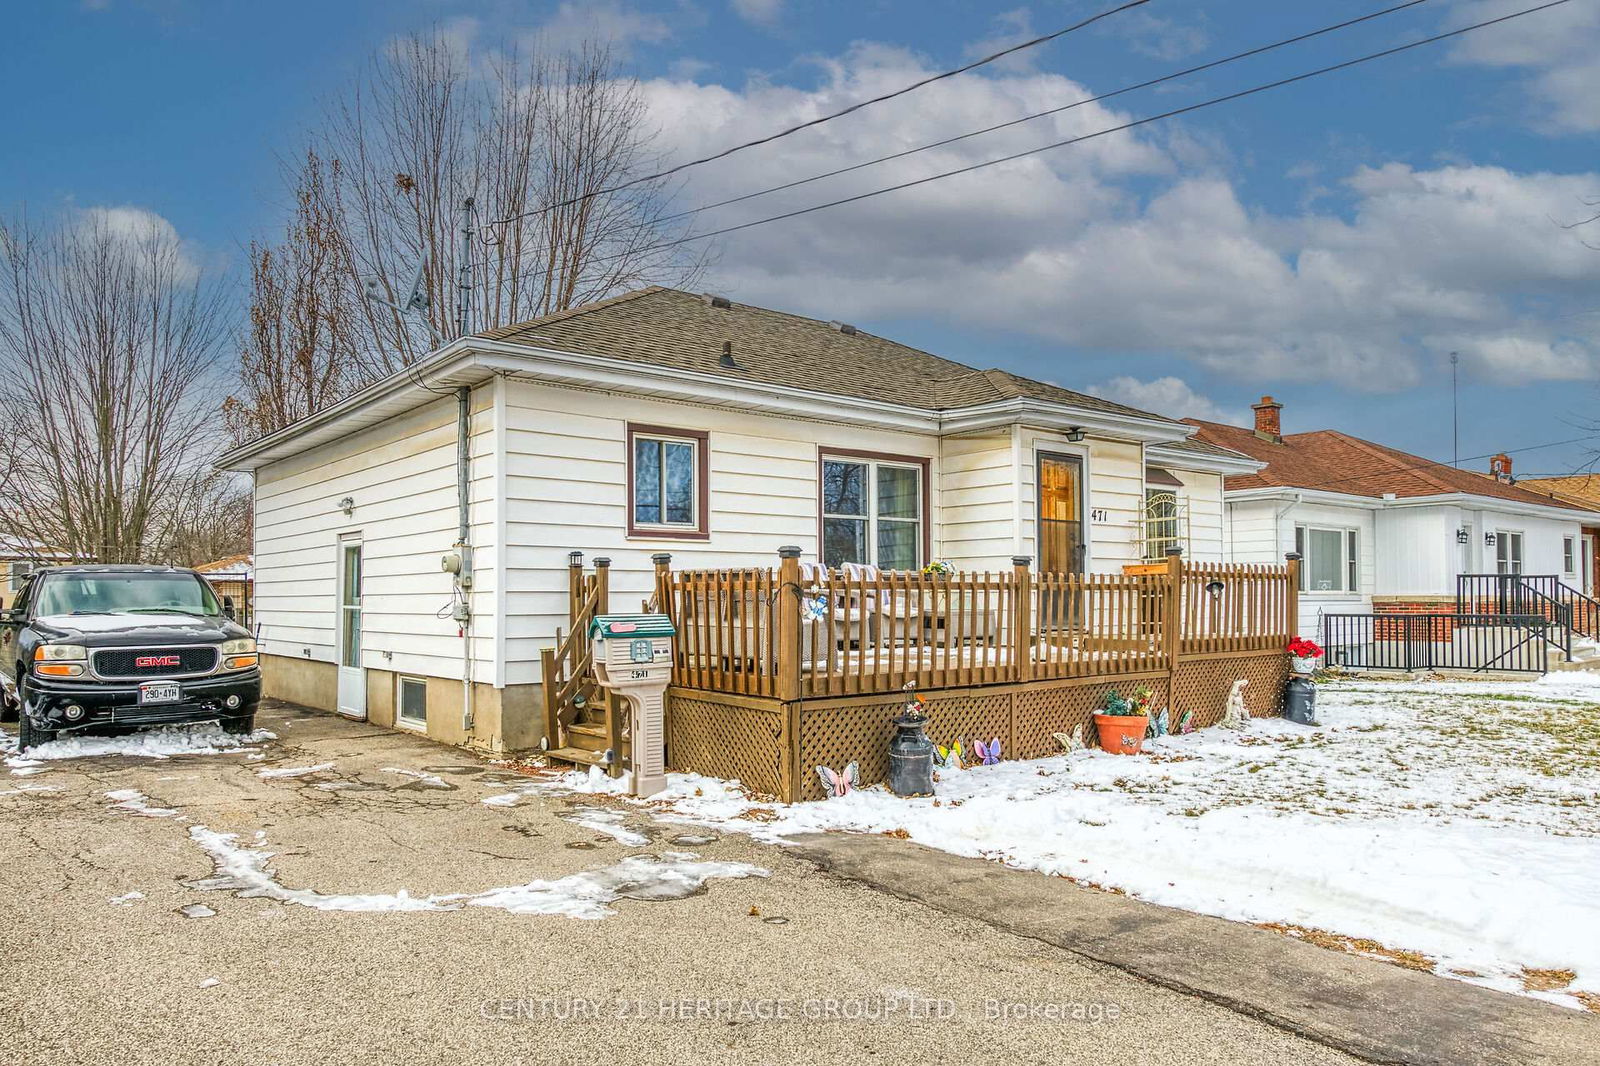
St. Catharines, Bunting/Linwell, L2M 2M8
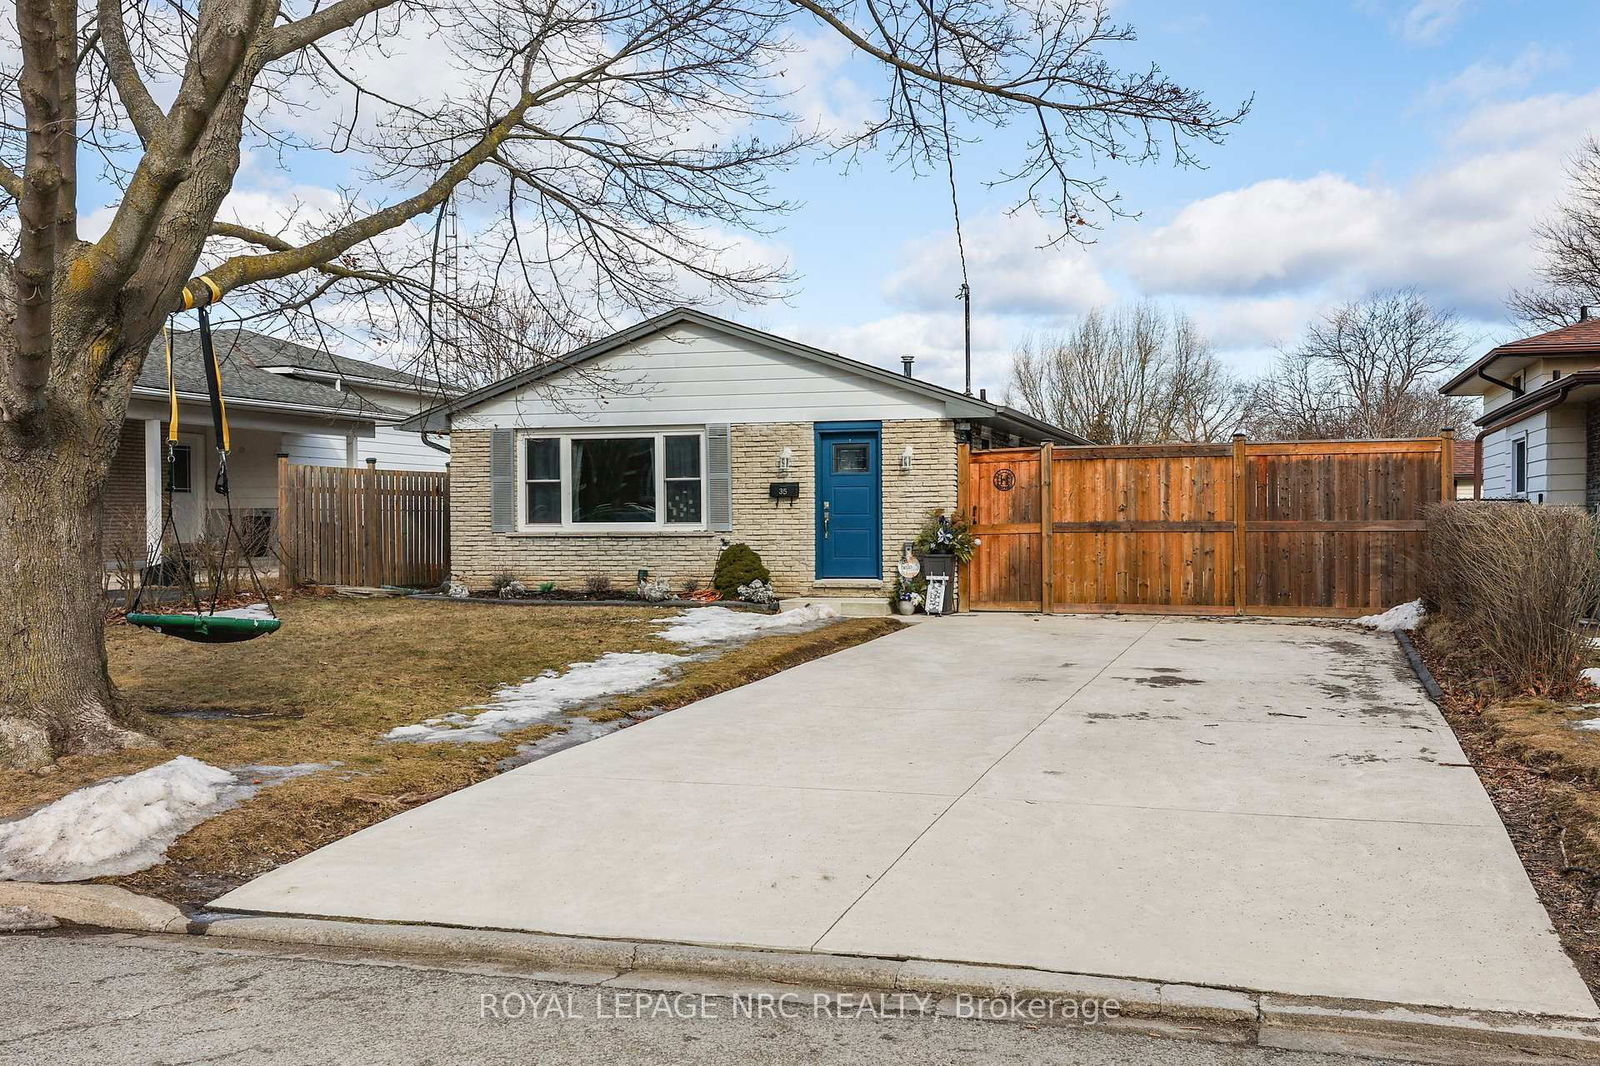
St. Catharines, Carlton/Bunting, L2M 3Z3
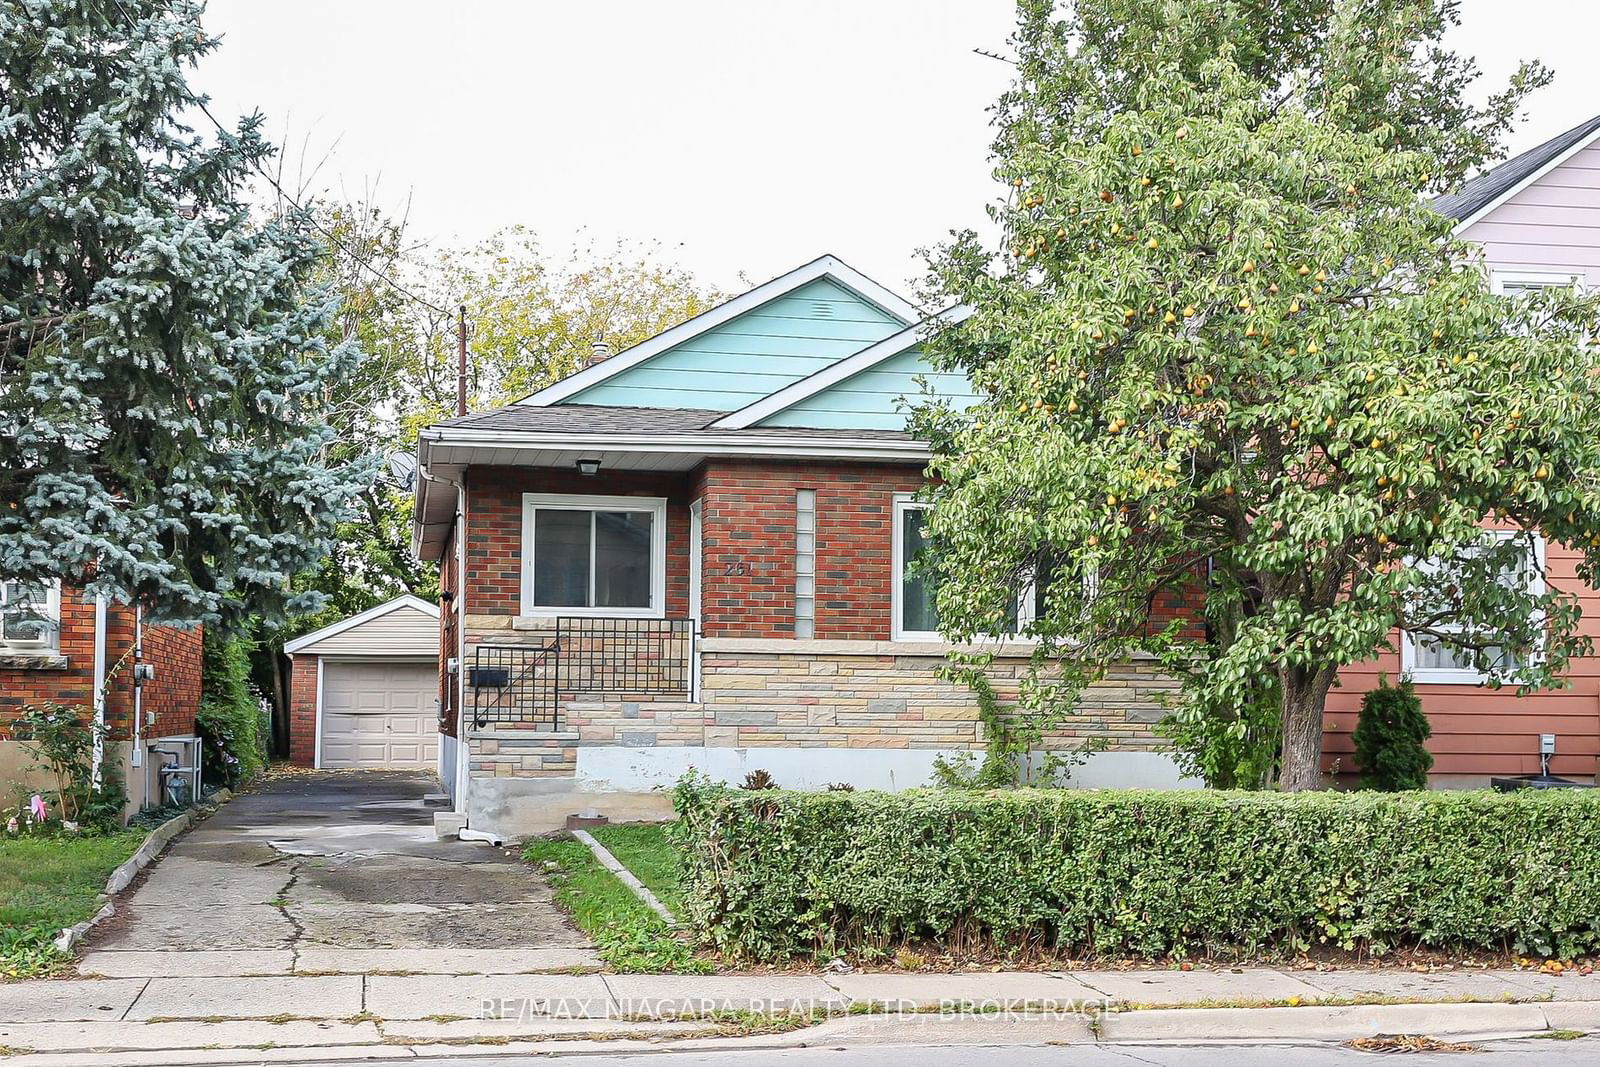
St. Catharines, Carlton/Bunting, L2M 6B5